
PUBLISHER: Global Market Insights Inc. | PRODUCT CODE: 1871319

PUBLISHER: Global Market Insights Inc. | PRODUCT CODE: 1871319
Prebiotics Market Opportunity, Growth Drivers, Industry Trend Analysis, and Forecast 2025 - 2034
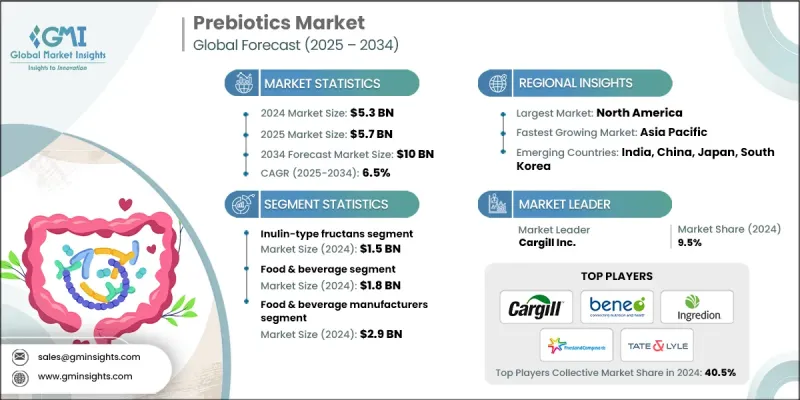
The Global Prebiotics Market was valued at USD 5.3 billion in 2024 and is estimated to grow at a CAGR of 6.5% to reach USD 10 billion by 2034.
Prebiotics are non-digestible ingredients that help stimulate the growth of beneficial gut bacteria, supporting digestive wellness and overall health. They are naturally present in several plant-based sources and are increasingly being incorporated into functional foods, beverages, and supplements. Rising consumer interest in gut health, immunity, and preventive wellness has positioned prebiotics as a crucial component in the broader health and nutrition industry. Advances in extraction and formulation technologies have improved the stability and potency of prebiotics, enabling their use in a wider range of applications. Innovations such as enzymatic processing and microencapsulation are enhancing the efficiency of prebiotic ingredients and boosting their compatibility with various product formulations. Growing preferences for natural, plant-based, and clean-label products are further fueling market demand. The shift toward preventive healthcare and lifestyle-driven wellness has encouraged food and supplement manufacturers to introduce prebiotic-enhanced offerings that address digestive balance and immunity. Additionally, increasing awareness of the gut-brain connection and its role in mental and physical health continues to expand the global market, particularly across urbanized and developed economies.
| Market Scope | |
|---|---|
| Start Year | 2024 |
| Forecast Year | 2025-2034 |
| Start Value | $5.3 Billion |
| Forecast Value | $10 Billion |
| CAGR | 6.5% |
In 2024, the inulin-type fructans segment generated USD 1.5 billion. Along with fructooligosaccharides, these prebiotic compounds play a crucial role in maintaining gut microbiota balance and promoting digestive well-being. Resistant starch and mannan-oligosaccharides (MOS) are also witnessing rising demand due to their metabolic and immune-boosting benefits. MOS is gaining traction in both human and animal nutrition, creating opportunities across functional foods and feed applications. Together, these compounds represent a promising growth avenue in the evolving field of functional and fortified nutrition.
The food & beverage segment generated USD 1.8 billion in 2024. It remains the primary application area for prebiotics, as consumer focus shifts toward products that enhance immunity and digestive function. Dietary supplements are experiencing rapid expansion driven by the rising trend of personalized and preventive nutrition, with consumers increasingly integrating prebiotics into their daily wellness routines. Infant formula and baby nutrition products continue to incorporate prebiotics to promote healthy gut flora and strengthen immune development in infants, fueling consistent demand across global markets.
U.S. Prebiotics Market held 82.2% and generated USD 1.36 billion in 2024. North America remains a strong hub for prebiotics growth, driven by heightened awareness of gut health and immunity among consumers. In the U.S., the preference for functional and clean-label products is shaping product innovation and accelerating adoption across food, beverage, and dietary supplement categories. Manufacturers are continuously improving formulations and diversifying product portfolios to meet the rising expectations of health-conscious consumers throughout the region.
Key companies active in the Global Prebiotics Market include DSM Nutritional Products, Roquette Freres, Beneo GmbH, ADM (Archer Daniels Midland), Cargill Inc., FrieslandCampina Ingredients, Tate & Lyle PLC, Nexira, Ingredion Inc., CJ CheilJedang, Kerry Group plc, Jarrow Formulas, Clasado Biosciences, OptiBiotix Health, Tereos Group, Samyang Holdings, Sensus (Royal Cosun), Quantum Hi-Tech, Tata Chemicals, BAOLINGBAO Biology, Prenexus Health, Meiji Holdings, Cosucra, Yakult Honsha Co., Ltd., and Jennewein Biotechnologie. Companies in the Prebiotics Market are enhancing their global footprint through strategic mergers, collaborations, and capacity expansions to meet growing consumer demand. Leading firms are investing in R&D to develop novel prebiotic formulations that improve digestive efficiency, stability, and functional integration across diverse food and supplement applications. Emphasis is placed on producing clean-label and plant-based prebiotics that align with sustainability and health trends. Many companies are strengthening their supply chains to ensure consistent product quality and sourcing transparency.
Table of Contents
Chapter 1 Methodology & Scope
- 1.1 Market scope and definition
- 1.2 Research design
- 1.2.1 Research approach
- 1.2.2 Data collection methods
- 1.3 Data mining sources
- 1.3.1 Global
- 1.3.2 Regional/Country
- 1.4 Base estimates and calculations
- 1.4.1 Base year calculation
- 1.4.2 Key trends for market estimation
- 1.5 Primary research and validation
- 1.5.1 Primary sources
- 1.6 Forecast model
- 1.7 Research assumptions and limitations
Chapter 2 Executive Summary
- 2.1 Industry 3600 synopsis
- 2.2 Key market trends
- 2.2.1 Product type
- 2.2.2 Application
- 2.2.3 End use industry
- 2.2.4 Regional
- 2.3 TAM Analysis, 2025-2034
- 2.4 CXO perspectives: Strategic imperatives
- 2.4.1 Executive decision points
- 2.4.2 Critical success factors
- 2.5 Future outlook and strategic recommendations
Chapter 3 Industry Insights
- 3.1 Industry ecosystem analysis
- 3.1.1 Supplier landscape
- 3.1.2 Profit margin
- 3.1.3 Value addition at each stage
- 3.1.4 Factor affecting the value chain
- 3.1.5 Disruptions
- 3.2 Industry impact forces
- 3.2.1 Growth drivers
- 3.2.1.1 Increasing consumer focus on health and wellness
- 3.2.1.2 Expansion of functional food & beverage sector
- 3.2.1.3 Technological advancements in extraction & formulation
- 3.2.1 Growth drivers
- 3.3 Industry pitfalls and challenges
- 3.3.1 High production and processing costs
- 3.3.2 Regulatory and labeling challenges
- 3.4 Market opportunities
- 3.4.1 Growing vegan and plant-based market
- 3.4.2 Integration with synbiotic products
- 3.4.3 Use in infant formula and elderly nutrition
- 3.5 Growth potential analysis
- 3.6 Regulatory landscape
- 3.6.1 North America
- 3.6.2 Europe
- 3.6.3 Asia Pacific
- 3.6.4 Latin America
- 3.6.5 Middle East & Africa
- 3.7 Porter's analysis
- 3.8 PESTEL analysis
- 3.9 Technology and innovation landscape
- 3.9.1 Current technological trends
- 3.9.2 Emerging technologies
- 3.10 Price trends
- 3.10.1 By region
- 3.10.2 By product type
- 3.11 Future market trends
- 3.12 Technology and innovation landscape
- 3.12.1 Current technological trends
- 3.12.2 Emerging technologies
- 3.13 Patent landscape
- 3.14 Trade statistics (HS code) (Note: the trade statistics will be provided for key countries only)
- 3.14.1 Major importing countries
- 3.14.2 Major exporting countries
- 3.15 Sustainability and environmental aspects
- 3.15.1 Sustainable practices
- 3.15.2 Waste reduction strategies
- 3.15.3 Energy efficiency in production
- 3.15.4 Eco-friendly initiatives
- 3.16 Carbon footprint consideration
Chapter 4 Competitive Landscape, 2024
- 4.1 Introduction
- 4.2 Company market share analysis
- 4.2.1 By region
- 4.2.1.1 North America
- 4.2.1.2 Europe
- 4.2.1.3 Asia Pacific
- 4.2.1.4 LATAM
- 4.2.1.5 MEA
- 4.2.1 By region
- 4.3 Company matrix analysis
- 4.4 Competitive analysis of major market players
- 4.5 Competitive positioning matrix
- 4.6 Key developments
- 4.6.1 Mergers & acquisitions
- 4.6.2 Partnerships & collaborations
- 4.6.3 New product launches
- 4.6.4 Expansion plans
Chapter 5 Market Estimates and Forecast, By Product Type, 2021-2034 (USD Million) (Kilo Tons)
- 5.1 Key trends
- 5.2 Inulin-Type Fructans
- 5.3 Fructooligosaccharides (FOS)
- 5.4 Galactooligosaccharides (GOS)
- 5.5 Human Milk Oligosaccharides (HMOs)
- 5.6 Resistant starch
- 5.7 Mannan-oligosaccharides (MOS)
- 5.8 Others
Chapter 6 Market Estimates and Forecast, By Application, 2021-2034 (USD Million) (Kilo Tons)
- 6.1 Food & beverage industry
- 6.2 Dietary supplements
- 6.3 Infant formula & baby food
- 6.4 Animal feed & nutrition
- 6.5 Cosmetics & personal care
- 6.6 Pharmaceutical & medical applications
Chapter 7 Market Estimates and Forecast, By End Use Industry, 2021-2034 (USD Million) (Kilo Tons)
- 7.1 Key trends
- 7.2 Food & beverage manufacturers
- 7.3 Pharmaceutical companies
- 7.4 Animal feed manufacturers
- 7.5 Cosmetics & personal care companies
Chapter 8 Market Estimates and Forecast, By Region, 2021-2034 (USD Million) (Kilo Tons)
- 8.1 Key trends
- 8.2 North America
- 8.2.1 U.S.
- 8.2.2 Canada
- 8.3 Europe
- 8.3.1 Germany
- 8.3.2 UK
- 8.3.3 France
- 8.3.4 Spain
- 8.3.5 Italy
- 8.3.6 Rest of Europe
- 8.4 Asia Pacific
- 8.4.1 China
- 8.4.2 India
- 8.4.3 Japan
- 8.4.4 Australia
- 8.4.5 South Korea
- 8.4.6 Rest of Asia Pacific
- 8.5 Latin America
- 8.5.1 Brazil
- 8.5.2 Mexico
- 8.5.3 Argentina
- 8.5.4 Rest of Latin America
- 8.6 Middle East and Africa
- 8.6.1 Saudi Arabia
- 8.6.2 South Africa
- 8.6.3 UAE
- 8.6.4 Rest of Middle East and Africa
Chapter 9 Company Profiles
- 9.1 ADM (Archer Daniels Midland)
- 9.2 BAOLINGBAO Biology
- 9.3 Beneo GmbH
- 9.4 Cargill Inc.
- 9.5 CJ CheilJedang
- 9.6 Clasado Biosciences
- 9.7 Cosucra
- 9.8 DSM Nutritional Products
- 9.9 FrieslandCampina Ingredients
- 9.10 Ingredion Inc.
- 9.11 Jarrow Formulas
- 9.12 Jennewein Biotechnologie
- 9.13 Kerry Group plc
- 9.14 Meiji Holdings
- 9.15 Nexira
- 9.16 OptiBiotix Health
- 9.17 Prenexus Health
- 9.18 Quantum Hi-Tech
- 9.19 Roquette Freres
- 9.20 Samyang Holdings
- 9.21 Sensus (Royal Cosun)
- 9.22 Tate & Lyle PLC
- 9.23 Tereos Group
- 9.24 Tata Chemicals
- 9.25 Yakult Honsha Co., Ltd.

