
PUBLISHER: Global Market Insights Inc. | PRODUCT CODE: 1667202

PUBLISHER: Global Market Insights Inc. | PRODUCT CODE: 1667202
AC Contactor Market Opportunity, Growth Drivers, Industry Trend Analysis, and Forecast 2025 - 2034
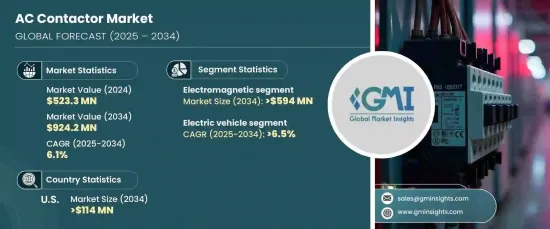
The Global AC Contactor Market was valued at USD 523.3 million in 2024 and is projected to grow at a steady CAGR of 6.1% from 2025 to 2034. Key drivers of this growth include advancements in industrial automation, the increasing need for efficient electrical systems, and rising demand across residential, commercial, and industrial sectors. The ongoing innovations in AC contactor technologies, such as improved durability, enhanced energy efficiency, and more compact designs, are helping accelerate market adoption. These developments have fostered greater implementation in various sectors, significantly contributing to the overall market expansion.
Additionally, the growing integration of smart contactors equipped with Internet of Things (IoT) capabilities is further shaping the industry. This technology allows for real-time monitoring and remote operation, aligning well with the rising demand for smart energy management systems. The market dynamics are also influenced by the growing adoption of renewable energy solutions and increased electrification across industries, which demand reliable switching and control mechanisms for energy distribution. These factors are playing a crucial role in the development of the global AC contactor market.
| Market Scope | |
|---|---|
| Start Year | 2024 |
| Forecast Year | 2025-2034 |
| Start Value | $523.3 Million |
| Forecast Value | $924.2 Million |
| CAGR | 6.1% |
The electromagnetic AC contactor segment is expected to surpass USD 594 million by 2034, driven by the rising focus on energy efficiency and the increasing use of green technologies. This shift is pushing the development of energy-efficient electromagnetic contactors that meet high energy standards and sustainability goals. Moreover, digitalization, as well as the inclusion of contactors in IoT platforms, is gaining traction. These advancements enable remote monitoring, predictive maintenance, and automation in smart systems, thereby enhancing the industry's business ecosystem.
In particular, the electric vehicle (EV) sector is expected to see strong growth, with the AC contactor market in this domain projected to grow at a CAGR of over 6.5% through 2034. The expanding adoption of electric vehicles, driven by environmental concerns and government incentives, is a key factor contributing to this trend. AC contactors are vital in EVs, helping to manage power flow and ensure the smooth operation of electrical components, thereby supporting the industry's rapid growth.
In the U.S., the AC contactor market is on track to exceed USD 114 million by 2034. The increasing use of smart technologies and IoT-enabled contactors is revolutionizing the industry, facilitating real-time monitoring and maintenance, and enabling seamless integration into smart energy systems and grids. The rise in electric vehicle adoption also plays a significant role, with contactors ensuring safe and efficient power distribution in EV applications. Moreover, the growing emphasis on renewable energy projects and industrial electrification continues to drive demand for high-quality switching and control solutions.
Table of Contents
Chapter 1 Methodology & Scope
- 1.1 Market scope & definitions
- 1.2 Market estimates & forecast parameters
- 1.3 Forecast calculation
- 1.4 Data sources
- 1.4.1 Primary
- 1.4.2 Secondary
- 1.4.2.1 Paid
- 1.4.2.2 Public
Chapter 2 Executive Summary
- 2.1 Industry synopsis, 2021 - 2034
Chapter 3 Industry Insights
- 3.1 Industry ecosystem analysis
- 3.2 Regulatory landscape
- 3.3 Industry impact forces
- 3.3.1 Growth drivers
- 3.3.2 Industry pitfalls & challenges
- 3.4 Growth potential analysis
- 3.5 Porter's Analysis
- 3.5.1 Bargaining power of suppliers
- 3.5.2 Bargaining power of buyers
- 3.5.3 Threat of new entrants
- 3.5.4 Threat of substitutes
- 3.6 PESTEL Analysis
Chapter 4 Competitive Landscape, 2024
- 4.1 Introduction
- 4.2 Strategic outlook
- 4.3 Innovation & sustainability landscape
Chapter 5 Market Size and Forecast, By Product, 2021 – 2034 (USD Million)
- 5.1 Key trends
- 5.2 Electromagnetic contactor
- 5.3 Permanent magnet contactor
Chapter 6 Market Size and Forecast, By End Use, 2021 – 2034 (USD Million)
- 6.1 Key trends
- 6.2 Electric vehicles
- 6.3 Industrial machinery
- 6.4 Renewable energy
- 6.5 Others
Chapter 7 Market Size and Forecast, By Region, 2021 – 2034 (USD Million)
- 7.1 Key trends
- 7.2 North America
- 7.2.1 U.S.
- 7.2.2 Canada
- 7.3 Europe
- 7.3.1 Germany
- 7.3.2 France
- 7.3.3 UK
- 7.3.4 Spain
- 7.3.5 Italy
- 7.4 Asia Pacific
- 7.4.1 China
- 7.4.2 India
- 7.4.3 Japan
- 7.4.4 South Korea
- 7.4.5 Australia
- 7.5 Middle East & Africa
- 7.5.1 Saudi Arabia
- 7.5.2 UAE
- 7.5.3 South Africa
- 7.6 Latin America
- 7.6.1 Brazil
- 7.6.2 Argentina
Chapter 8 Company Profiles
- 8.1 ABB
- 8.2 Carlo Gavazzi
- 8.3 Curtiss Wright
- 8.4 Eaton
- 8.5 Fuji Electric
- 8.6 Geya Electrical
- 8.7 L&T
- 8.8 Lovato Electric
- 8.9 LS Electric
- 8.10 Mitsubishi Electric
- 8.11 Rockwell Automation
- 8.12 Schaltbau
- 8.13 Schmersal
- 8.14 Schneider Electric
- 8.15 Sensata Technologies
- 8.16 Siemens
- 8.17 TE Connectivity
- 8.18 Toshiba

