
PUBLISHER: Global Market Insights Inc. | PRODUCT CODE: 1685168

PUBLISHER: Global Market Insights Inc. | PRODUCT CODE: 1685168
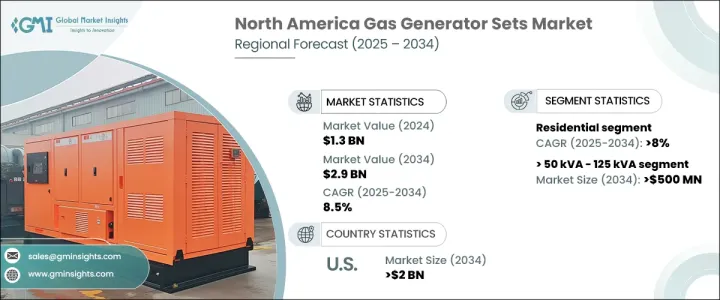
North America Gas Generator Sets Market Opportunity, Growth Drivers, Industry Trend Analysis, and Forecast 2025 - 2034
North America Gas Generator Sets Market is on a strong growth trajectory, valued at USD 1.3 billion in 2024 and projected to expand at a CAGR of 8.5% between 2025 and 2034. The increasing demand for reliable power solutions, driven by grid instability and frequent blackouts, is fueling market expansion. The region faces a growing reliance on backup power due to extreme weather events and aging power infrastructure, making gas generator sets an essential solution for homes and businesses. As more industries shift towards sustainable and cost-effective power alternatives, the adoption of gas-powered generator sets is accelerating.
In addition, technological advancements, including improved fuel efficiency and lower emissions, are boosting market penetration. The growing emphasis on peak shaving applications, where generator sets supplement the grid during high demand periods, further highlights their role in energy management strategies. Financial incentives and government policies promoting cleaner energy solutions are expected to push the industry forward, making gas generators an attractive investment across multiple sectors.
| Market Scope | |
|---|---|
| Start Year | 2024 |
| Forecast Year | 2025-2034 |
| Start Value | $1.3 Billion |
| Forecast Value | $2.9 Billion |
| CAGR | 8.5% |
In terms of power rating, gas generator sets ranging from greater than 50 kVA to 125 kVA are expected to generate USD 500 million by 2034. These units stand out for their efficiency, versatility, and affordability, making them a preferred choice for both residential and commercial applications. Cost-conscious consumers are increasingly turning to these generator sets for effective and reliable backup power solutions. In addition, the industrial sector is rapidly adopting peak shaving gensets to ensure uninterrupted power supply, particularly during high-demand periods. Stringent regulations promoting energy efficiency and lower emissions, along with financial incentives, are accelerating the adoption of these mid-range power generators.
On the basis of end-use, the residential segment of the North America gas generator sets market is projected to witness a CAGR of 8% through 2034. The demand surge is driven by an aging grid infrastructure and extreme weather conditions, both of which frequently result in power outages. Homeowners are increasingly investing in standby gas generator sets to ensure a reliable supply of electricity for heating, cooling, and essential appliances. These systems provide an uninterrupted power source during blackouts, making them particularly valuable for regions prone to frequent electrical disruptions.
The U.S. gas generator sets market alone is expected to generate USD 2 billion by 2034, driven by the escalating costs of data center outages and the growing adoption of cleaner, more efficient technologies. Environmental concerns and corporate sustainability initiatives are prompting businesses to embrace advanced generator solutions that align with their long-term energy strategies. Aging grid systems, severe weather-related disasters, and the rapid expansion of the commercial and industrial sectors are among the primary market drivers. Businesses are investing in high-performance gas generators to mitigate the financial risks associated with unexpected power failures, ensuring operational continuity.
Table of Contents
Chapter 1 Methodology & Scope
- 1.1 Market scope & definitions
- 1.2 Market estimates & forecast parameters
- 1.3 Forecast calculation
- 1.4 Data sources
- 1.4.1 Primary
- 1.4.2 Secondary
- 1.4.2.1 Paid
- 1.4.2.2 Public
Chapter 2 Industry Insights
- 2.1 Industry ecosystem analysis
- 2.2 Regulatory landscape
- 2.3 Industry impact forces
- 2.3.1 Growth drivers
- 2.3.2 Industry pitfalls & challenges
- 2.4 Growth potential analysis
- 2.5 Porter's analysis
- 2.5.1 Bargaining power of suppliers
- 2.5.2 Bargaining power of buyers
- 2.5.3 Threat of new entrants
- 2.5.4 Threat of substitutes
- 2.6 PESTEL analysis
Chapter 3 Competitive Landscape, 2024
- 3.1 Introduction
- 3.2 Strategic outlook
- 3.3 Innovation & sustainability landscape
Chapter 4 Market Size and Forecast, By Power Rating, 2021 – 2034 ('000 Units & USD Million)
- 4.1 Key trends
- 4.2 ≤ 50 kVA
- 4.3 > 50 kVA - 125 kVA
- 4.4 > 125 kVA - 200 kVA
- 4.5 > 200 kVA - 330 kVA
- 4.6 > 330 kVA - 750 kVA
- 4.7 > 750 kVA
Chapter 5 Market Size and Forecast, By End Use, 2021 – 2034 ('000 Units & USD Million)
- 5.1 Key trends
- 5.2 Residential
- 5.3 Commercial
- 5.4 Industrial
Chapter 6 Market Size and Forecast, By Application, 2021 – 2034 ('000 Units & USD Million)
- 6.1 Key trends
- 6.2 Standby
- 6.3 Peak shaving
- 6.4 Prime/continuous
Chapter 7 Market Size and Forecast, By Country, 2021 – 2034 ('000 Units & USD Million)
- 7.1 Key trends
- 7.2 U.S.
- 7.3 Canada
Chapter 8 Company Profiles
- 8.1 Aggreko
- 8.2 Briggs & Stratton
- 8.3 Caterpillar
- 8.4 Champion Power Equipment
- 8.5 Cummins
- 8.6 Doosan Portable Power
- 8.7 DuroMax Power Equipment
- 8.8 FIRMAN Power Equipment
- 8.9 Generac Power Systems
- 8.10 Gillette Generators
- 8.11 HIMOINSA
- 8.12 Rehlko
- 8.13 MTS Power Products
- 8.14 Perkins Engines Company
- 8.15 Rolls Royce
- 8.16 Westinghouse Electric Corporation

