
PUBLISHER: Global Market Insights Inc. | PRODUCT CODE: 1741023

PUBLISHER: Global Market Insights Inc. | PRODUCT CODE: 1741023
Asia Pacific Hydrogen Energy Storage Market Opportunity, Growth Drivers, Industry Trend Analysis, and Forecast 2025 - 2034
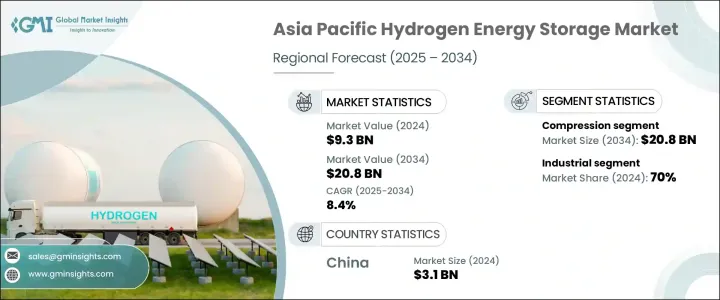
Asia Pacific Hydrogen Energy Storage Market was valued at USD 9.3 billion in 2024 and is estimated to grow at a CAGR of 8.4% to reach USD 20.8 billion by 2034, driven by rising investments in hydrogen infrastructure across regional economies and a growing need to secure long-term energy independence. Globally, the hydrogen energy storage market is gaining massive traction as governments, industries, and energy providers recognize hydrogen's unique potential to bridge the gap between renewable energy generation and reliable supply. In the Asia Pacific region, rapid industrialization, ambitious net-zero targets, and heightened concerns over energy security are pushing hydrogen storage to the forefront of clean energy strategies. Hydrogen's role extends beyond just storage-it enables flexible power management, stabilizes grids, and supports the electrification of heavy transport and industry. Countries across the Asia Pacific are aggressively investing in scalable hydrogen storage ecosystems to meet future energy demands, combat volatility in global energy markets, and align with their national decarbonization commitments.
As the shift toward decarbonization accelerates, countries in the region are actively seeking reliable and clean alternatives to fossil fuels. Hydrogen's ability to store and distribute energy efficiently makes it an attractive solution for industrial, transport, and grid-related applications. Alongside long-term energy diversification goals, regional strategies clearly focus on enhancing resiliency against global supply disruptions and mitigating geopolitical energy risks.
| Market Scope | |
|---|---|
| Start Year | 2024 |
| Forecast Year | 2025-2034 |
| Start Value | $9.3 Billion |
| Forecast Value | $20.8 Billion |
| CAGR | 8.4% |
Across the region, countries are ramping up efforts to develop regional hydrogen ecosystems. A strong shift toward decentralized hydrogen systems is gaining momentum, where hydrogen is produced locally using renewable sources and stored for future use. These distributed models are emerging as critical solutions for off-grid energy access and rural electrification. At the same time, governments are advancing R&D initiatives aimed at improving the scalability and efficiency of hydrogen storage systems, particularly in mobility and power applications. Technology developers are stepping up by creating cost-effective, compact storage solutions to meet diverse emerging demand scenarios.
The compression-based storage systems segment is expected to generate USD 20.8 billion by 2034. Compression continues to dominate as the most widely adopted method for storing hydrogen, offering high energy density, superior reliability, and compliance with strict safety standards. As clean mobility gains traction, compressed hydrogen is fast becoming the preferred solution for fueling electric buses, commercial trucks, and other transport fleets. High-pressure tanks provide a compact and efficient way to store and deliver hydrogen for mobile applications, ensuring consistent performance and rapid refueling.
The industrial segment led the application market in 2024, capturing a 70% share, and is projected to maintain its leadership through the forecast period. Hydrogen is playing a transformative role in industrial power systems, especially in areas where access to conventional electricity remains limited or unreliable. Industries are increasingly turning to hydrogen-based fuel cells to secure energy reliability while progressing toward their decarbonization goals. This trend is supporting broader energy transition strategies and encouraging large-scale investments in hydrogen storage capacity.
China Hydrogen Energy Storage Market generated USD 3.1 billion in 2024, driven by the expansion of renewable energy infrastructure, particularly in solar, wind, and hydropower. This surge has created an urgent need for effective energy storage solutions. Hydrogen fits perfectly into this demand, acting as a buffer for surplus power generation and helping the country balance its grid operations more efficiently. Strategic deployment of hydrogen storage is advancing China's energy resilience and supporting its carbon neutrality ambitions.
Key players in the Global Hydrogen Energy Storage Market include FuelCell Energy, Cockerill Jingli Hydrogen, ITM Power, Linde, Air Liquide, McPhy Energy, Nel, ENGIE, Gravitricity, and Air Products. In the Asia Pacific market, companies are focusing on joint ventures and partnerships with utilities, transportation agencies, and renewable energy providers to strengthen their presence. Investment in research and development to create high-efficiency hydrogen storage systems and build a robust refueling infrastructure remains a central strategy. Firms are closely aligning with government sustainability agendas to secure grants and incentives while developing resilient local supply chains to mitigate international trade risks.
Table of Contents
Chapter 1 Methodology & Scope
- 1.1 Market definitions
- 1.2 Base estimates & calculations
- 1.3 Forecast calculation
- 1.4 Data sources
- 1.4.1 Primary
- 1.4.2 Secondary
- 1.4.2.1 Paid
- 1.4.2.2 Public
Chapter 2 Industry Insights
- 2.1 Industry ecosystem analysis
- 2.2 Impact of Trump administration tariffs on trade & overall industry
- 2.3 Regulatory landscape
- 2.4 Industry impact forces
- 2.4.1 Growth drivers
- 2.4.2 Industry pitfalls & challenges
- 2.5 Growth potential analysis
- 2.6 Porter's analysis
- 2.6.1 Bargaining power of suppliers
- 2.6.2 Bargaining power of buyers
- 2.6.3 Threat of new entrants
- 2.6.4 Threat of substitutes
- 2.7 PESTEL analysis
Chapter 3 Competitive Landscape, 2024
- 3.1 Introduction
- 3.2 Strategic outlook
- 3.3 Innovation & sustainability landscape
Chapter 4 Market Size and Forecast, By Method, 2021 - 2034, (USD Million)
- 4.1 Key trends
- 4.2 Compression
- 4.3 Liquefaction
- 4.4 Material-based
Chapter 5 Market Size and Forecast, By Application, 2021 - 2034, (USD Million)
- 5.1 Key trends
- 5.2 Industrial
- 5.3 Transportation
- 5.4 Stationary
- 5.5 Others
Chapter 6 Market Size and Forecast, By Country, 2021 - 2034, (USD Million)
- 6.1 Key trends
- 6.2 China
- 6.3 Japan
- 6.4 India
Chapter 7 Company Profiles
- 7.1 Air Liquide
- 7.2 Air Products
- 7.3 Cockerill Jingli Hydrogen
- 7.4 ENGIE
- 7.5 FuelCell Energy
- 7.6 Gravitricity
- 7.7 ITM Power
- 7.8 Linde
- 7.9 McPhy Energy
- 7.10 Nel

