
PUBLISHER: Global Market Insights Inc. | PRODUCT CODE: 1716695

PUBLISHER: Global Market Insights Inc. | PRODUCT CODE: 1716695
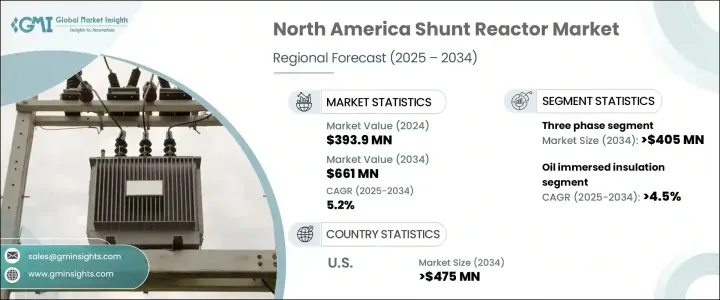
North America Shunt Reactor Market Opportunity, Growth Drivers, Industry Trend Analysis, and Forecast 2025 - 2034
North America Shunt Reactor Market, valued at USD 393.9 million in 2024, is projected to grow at a CAGR of 5.2% between 2025 and 2034, driven by robust investments in power grid infrastructure, the integration of renewable energy sources, and the rising demand for voltage stabilization across high-voltage transmission systems. As the region undergoes a massive shift toward renewable energy, including wind and solar, utility companies are placing greater emphasis on upgrading transmission networks to ensure grid reliability and efficiency. The increasing complexity of modern grids, coupled with fluctuating power flows due to intermittent renewable energy generation, is further amplifying the need for advanced grid components like shunt reactors.
These devices play a critical role in maintaining voltage levels and correcting power factor issues, making them indispensable as utilities strive to meet evolving regulatory standards, enhance operational efficiency, and minimize transmission losses. Furthermore, the shift toward smart grids and digital substations across the U.S. and Canada is creating sustained demand for high-performance shunt reactors that can handle dynamic grid requirements. The market is also benefiting from government-led initiatives aimed at strengthening the resilience of electrical networks in response to growing energy demands and climate-related disruptions. As utilities seek to balance renewable energy integration with grid stability, shunt reactors are becoming key components of next-generation energy infrastructure, ensuring consistent voltage control and improved power quality.
| Market Scope | |
|---|---|
| Start Year | 2024 |
| Forecast Year | 2025-2034 |
| Start Value | $393.9 Million |
| Forecast Value | $661 Million |
| CAGR | 5.2% |
The three-phase shunt reactor segment is expected to generate USD 405 million by 2034, emerging as a preferred choice for voltage regulation and power factor correction in high-voltage systems, including long-distance AC transmission and high-voltage direct current (HVDC) applications. As the need for voltage stability escalates due to the increasing deployment of renewable energy, particularly in offshore and remote areas, three-phase shunt reactors are gaining widespread traction. These reactors offer unmatched versatility and are critical for ensuring the stable operation of transmission lines that span large distances, supporting both traditional and renewable energy projects. Their capability to mitigate voltage fluctuations in complex transmission networks makes them indispensable for modern energy grids.
The oil-immersed insulation segment, which accounted for 58% market share in 2024, is projected to grow at a CAGR of 4.5% through 2034, driven by its proven reliability and efficiency in high-voltage applications. Fixed shunt reactors dominate this segment due to their cost-effectiveness in stabilizing power transmission networks. However, utilities are increasingly shifting toward variable shunt reactors to achieve greater flexibility, especially in areas where renewable energy sources introduce variability in power supply. These variable reactors are crucial for maintaining voltage stability and minimizing losses in regions with high renewable energy penetration.
The U.S. shunt reactor market, valued at USD 289.3 million in 2024, is witnessing robust growth fueled by substantial investments in power transmission infrastructure and grid modernization efforts. Shunt reactors are essential for enhancing grid reliability and ensuring efficient operation of high-voltage transmission networks across the country. The ongoing development of smart grids and digital substations, coupled with regulatory mandates focused on energy efficiency and grid resilience, is accelerating market expansion. Additionally, states with significant renewable energy installations, including wind and solar farms, are leading in the adoption of advanced shunt reactors to manage voltage stability and support dynamic grid operations.
Table of Contents
Chapter 1 Methodology & Scope
- 1.1 Market definitions
- 1.2 Base estimates & calculations
- 1.3 Forecast calculation
- 1.4 Data sources
- 1.4.1 Primary
- 1.4.2 Secondary
- 1.4.2.1 Paid
- 1.4.2.2 Public
Chapter 2 Executive Summary
- 2.1 Industry synopsis, 2021 - 2034
Chapter 3 Industry Insights
- 3.1 Industry ecosystem analysis
- 3.2 Regulatory landscape
- 3.3 Industry impact forces
- 3.3.1 Growth drivers
- 3.3.2 Industry pitfalls & challenges
- 3.4 Growth potential analysis
- 3.5 Porter's analysis
- 3.5.1 Bargaining power of suppliers
- 3.5.2 Bargaining power of buyers
- 3.5.3 Threat of new entrants
- 3.5.4 Threat of substitutes
- 3.6 PESTEL analysis
Chapter 4 Competitive Landscape, 2024
- 4.1 Strategic dashboard
- 4.2 Innovation & sustainability landscape
Chapter 5 Market Size and Forecast, By Phase, 2021 – 2034 (USD Million)
- 5.1 Key trends
- 5.2 Single phase
- 5.3 Three phase
Chapter 6 Market Size and Forecast, By Insulation, 2021 – 2034 (USD Million)
- 6.1 Key trends
- 6.2 Oil immersed
- 6.3 Air core
Chapter 7 Market Size and Forecast, By Product, 2021 – 2034 (USD Million)
- 7.1 Key trends
- 7.2 Fixed shunt reactors
- 7.3 Variable shunt reactors
Chapter 8 Market Size and Forecast, By End Use, 2021 – 2034 (USD Million)
- 8.1 Key trends
- 8.2 Electric utility
- 8.3 Renewable energy
Chapter 9 Market Size and Forecast, By Country, 2021 – 2034 (USD Million)
- 9.1 Key trends
- 9.2 U.S.
- 9.3 Canada
Chapter 10 Company Profiles
- 10.1 Alstom
- 10.2 CHINT Group
- 10.3 Elgin Power Solutions
- 10.4 Fuji Electric
- 10.5 General Electric
- 10.6 Hitachi Energy
- 10.7 Hyosung Heavy Industries
- 10.8 JSHP Transformer
- 10.9 MEIDENSHA
- 10.10 Nissin Electric
- 10.11 SGB SMIT
- 10.12 Shrihans Electricals
- 10.13 Siemens Energy
- 10.14 Toshiba
- 10.15 WEG

