
PUBLISHER: Global Market Insights Inc. | PRODUCT CODE: 1667062

PUBLISHER: Global Market Insights Inc. | PRODUCT CODE: 1667062
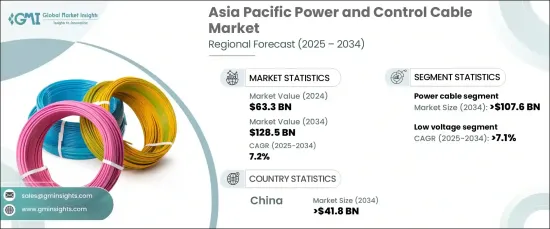
Asia Pacific Power and Control Cable Market Opportunity, Growth Drivers, Industry Trend Analysis, and Forecast 2025 - 2034
Asia Pacific Power And Control Cable Market, valued at USD 63.3 billion in 2024, is expected to experience significant growth, with a CAGR of 7.2% from 2025 to 2034. This growth is driven by the region's rapid industrialization and urbanization, which are stimulating investments in infrastructure, including energy generation, transmission, and distribution networks. The shift to renewable energy sources, such as solar and wind power, is further contributing to the market expansion, as these projects require specialized cabling solutions.
Additionally, the increasing adoption of energy-efficient systems and advancements in smart grid technologies are key factors driving demand for power and control cables in the region. As construction activities continue to surge, supported by both public and private investments, there is a growing need for cables in residential, commercial, and industrial projects. The growth of sectors like manufacturing, telecommunications, and IT also fuels demand for control cables. Favorable government policies and rising foreign direct investments are further facilitating market development in the region.
| Market Scope | |
|---|---|
| Start Year | 2024 |
| Forecast Year | 2025-2034 |
| Start Value | $63.3 Billion |
| Forecast Value | $128.5 Billion |
| CAGR | 7.2% |
The power cable segment is projected to exceed USD 107.6 billion by 2034. This growth is attributed to the strong push for renewable energy, with governments prioritizing efforts to reduce carbon emissions and enhance energy systems. This trend, particularly in the development of renewable energy projects, is driving a surge in demand for high-performance power cables that are essential for efficient energy transmission. Moreover, the urbanization seen in emerging economies is spurring investments in infrastructure such as smart cities, public utilities, and transportation systems, further supporting the demand for power and control cables.
The low voltage power cable segment in the Asia Pacific market is expected to grow at a robust CAGR of over 7.1% by 2034. This is due to the increased demand for reliable and efficient cables in large-scale infrastructure projects, especially in smart cities and rural electrification programs. Governments in the region are focused on improving electricity access in remote areas, which is further fueling the adoption of power cables for grid expansions and upgrades. Additionally, the continued shift to renewable energy sources, like solar and wind, is creating a growing need for advanced cable solutions that connect power generation facilities to transmission networks.
The power and control cable market in China is anticipated to surpass USD 41.8 billion by 2034. The country's significant investments in modernizing and expanding its power infrastructure, driven by growing electricity demands in both urban and rural areas, are creating a widespread need for these cables. As a leader in renewable energy capacity, China's push for large-scale solar, wind, and hydropower projects is driving demand for high-quality cables, ensuring efficient energy transmission and integration with power grids.
Table of Contents
Chapter 1 Methodology & Scope
- 1.1 Market definitions
- 1.2 Base estimates & calculations
- 1.3 Forecast calculation
- 1.4 Data sources
- 1.4.1 Primary
- 1.4.2 Secondary
- 1.4.2.1 Paid
- 1.4.2.2 Public
Chapter 2 Industry Insights
- 2.1 Industry ecosystem analysis
- 2.2 Regulatory landscape
- 2.3 Industry impact forces
- 2.3.1 Growth drivers
- 2.3.2 Industry pitfalls & challenges
- 2.4 Growth potential analysis
- 2.5 Porter's analysis
- 2.5.1 Bargaining power of suppliers
- 2.5.2 Bargaining power of buyers
- 2.5.3 Threat of new entrants
- 2.5.4 Threat of substitutes
- 2.6 PESTEL analysis
Chapter 3 Competitive landscape, 2024
- 3.1 Strategic dashboard
- 3.2 Innovation & sustainability landscape
Chapter 4 Market Size and Forecast, By Product, 2021 – 2034 (USD Million)
- 4.1 Key trends
- 4.2 Power cable
- 4.3 Control cable
Chapter 5 Market Size and Forecast, By Voltage, 2021 – 2034 (USD Million)
- 5.1 Key trends
- 5.2 Low voltage
- 5.2.1 LV power
- 5.2.2 LV control
- 5.3 Medium voltage
- 5.4 High voltage
Chapter 6 Market Size and Forecast, By Application, 2021 – 2034 (USD Million)
- 6.1 Key trends
- 6.2 Utilities
- 6.3 Industries
- 6.3.1 Power plants
- 6.3.2 Oil & gas
- 6.3.3 Cement
- 6.3.4 Others
Chapter 7 Market Size and Forecast, By Country, 2021 – 2034 (USD Million)
- 7.1 Key trends
- 7.2 China
- 7.3 India
- 7.4 Japan
- 7.5 South Korea
- 7.6 Australia
- 7.7 Rest of Asia Pacific
Chapter 8 Company Profiles
- 8.1 Belden
- 8.2 Bergen Cable Technology
- 8.3 Ducab
- 8.4 Encore Wire Corporation
- 8.5 Furukawa Electric
- 8.6 KEC International
- 8.7 Klaus Faber
- 8.8 LS Cable & System
- 8.9 Marmon Holdings
- 8.10 Nexans
- 8.11 NKT
- 8.12 Prysmian Group
- 8.13 Southwire Company
- 8.14 Sumitomo Electric Industries
- 8.15 The Okonite Company
- 8.16 TPC Wire & Cable

