
PUBLISHER: Global Market Insights Inc. | PRODUCT CODE: 1666672

PUBLISHER: Global Market Insights Inc. | PRODUCT CODE: 1666672
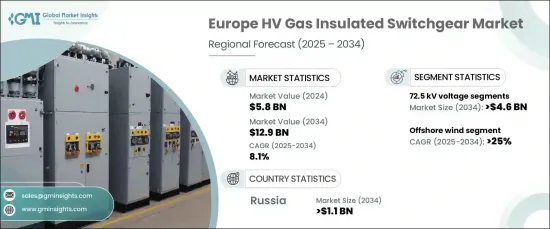
Europe HV Gas Insulated Switchgear Market Opportunity, Growth Drivers, Industry Trend Analysis, and Forecast 2025 - 2034
Europe HV Gas Insulated Switchgear Market, valued at USD 5.8 billion in 2024, is expected to experience steady growth at a CAGR of 8.1% from 2025 to 2034. This growth is driven by the increasing need for dependable and space-efficient power infrastructure. The growing demand for energy in both urban and industrial sectors, combined with the need for advanced power solutions, has led to a surge in the adoption of HV GIS. The shift toward renewable energy sources such as offshore wind farms calls for efficient, compact, and high-performance equipment to meet the energy requirements in confined spaces.
Furthermore, the ongoing push for more sustainable and efficient grid systems has prompted investments in HV GIS technology as a preferred alternative to traditional air-insulated switchgear. The reduction of carbon emissions and improvements in grid efficiency are at the forefront of regulatory concerns, making gas-insulated systems increasingly popular in meeting these goals. Major markets across the region are focusing on modernizing their electrical infrastructure, which includes replacing outdated systems with more reliable and eco-friendly options. Technological advancements, such as the development of sustainable alternatives to traditional insulation materials, continue to drive market expansion, aligning with the region's environmental objectives.
| Market Scope | |
|---|---|
| Start Year | 2024 |
| Forecast Year | 2025-2034 |
| Start Value | $5.8 Billion |
| Forecast Value | $12.9 Billion |
| CAGR | 8.1% |
The 72.5 kV voltage segment is expected to generate significant market value, potentially exceeding USD 4.6 billion by 2034. This segment's rapid adoption is mainly due to its capability to offer compact and reliable power solutions, particularly for medium-scale distribution and transmission networks. Its popularity is also tied to the growing trend of integrating renewable energy sources into power grids, where efficiency and space management are essential. As renewable power generation technologies expand, the demand for high-performance HV GIS systems that can withstand harsh environments is set to increase.
The offshore wind energy sector is anticipated to grow rapidly, with a projected CAGR of over 25% through 2034. As countries across Europe expand their offshore wind projects, the demand for HV GIS continues to rise, driven by the need for space-efficient, reliable, and durable equipment capable of managing high-voltage transmissions in offshore locations. This shift is central to achieving the renewable energy goals set by European nations and reducing reliance on fossil fuels.
In Russia, the HV gas insulated switchgear market is projected to reach USD 1.1 billion by 2034. This growth is linked to efforts to modernize the nation's aging power grid and improve the reliability of electricity transmission in extreme climates. The expansion of Russia's energy infrastructure, particularly in industrial sectors like oil and gas, further contributes to the rising demand for advanced GIS solutions. Additionally, Russia's increasing focus on renewable energy sources such as wind and hydroelectric power is helping propel the adoption of HV GIS systems.
Table of Contents
Chapter 1 Methodology & Scope
- 1.1 Market definitions
- 1.2 Base estimates & calculations
- 1.3 Forecast calculation
- 1.4 Data sources
- 1.4.1 Primary
- 1.4.2 Secondary
- 1.4.2.1 Paid
- 1.4.2.2 Public
Chapter 2 Industry Insights
- 2.1 Industry ecosystem analysis
- 2.2 Regulatory landscape
- 2.3 Industry impact forces
- 2.3.1 Growth drivers
- 2.3.2 Industry pitfalls & challenges
- 2.4 Growth potential analysis
- 2.5 Porter's analysis
- 2.5.1 Bargaining power of suppliers
- 2.5.2 Bargaining power of buyers
- 2.5.3 Threat of new entrants
- 2.5.4 Threat of substitutes
- 2.6 PESTEL analysis
Chapter 3 Competitive landscape, 2024
- 3.1 Strategic dashboard
- 3.2 Innovation & sustainability landscape
Chapter 4 Market Size and Forecast, By Capacity, 2021 – 2034 (USD Million)
- 4.1 Key trends
- 4.2 72.5 kV
- 4.3 145 kV
- 4.4 245 kV
- 4.5 275 kV
- 4.6 300 kV
- 4.7 400 kV
- 4.8 500 kV
- 4.9 765 kV
Chapter 5 Market Size and Forecast, By Application, 2021 – 2034 (USD Million)
- 5.1 Key trends
- 5.2 Offshore wind
- 5.3 Others
Chapter 6 Market Size and Forecast, By Country, 2021 – 2034 (USD Million)
- 6.1 Key trends
- 6.2 UK
- 6.3 France
- 6.4 Germany
- 6.5 Italy
- 6.6 Russia
- 6.7 Spain
Chapter 7 Company Profiles
- 7.1 ABB
- 7.2 Bharat Heavy Electricals
- 7.3 CG Power and Industrial Solutions
- 7.4 E + I Engineering
- 7.5 Eaton
- 7.6 Fuji Electric
- 7.7 General Electric
- 7.8 HD Hyundai Electric
- 7.9 Hitachi
- 7.10 Hyosung Heavy Industries
- 7.11 Lucy Group
- 7.12 Mitsubishi Electric
- 7.13 Ormazabal
- 7.14 Schneider Electric
- 7.15 Siemens
- 7.16 Skema
- 7.17 Toshiba

