
PUBLISHER: Global Market Insights Inc. | PRODUCT CODE: 1822632

PUBLISHER: Global Market Insights Inc. | PRODUCT CODE: 1822632
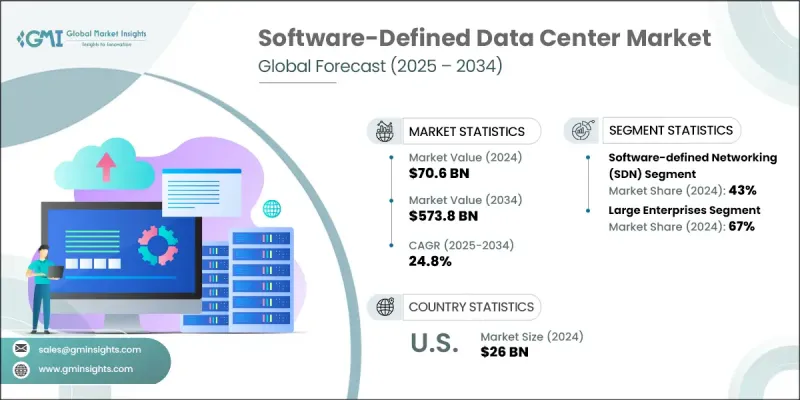
Software-Defined Data Center Market Opportunity, Growth Drivers, Industry Trend Analysis, and Forecast 2025 - 2034
The Global Software-Defined Data Center Market was valued at USD 70.6 billion in 2024 and is estimated to grow at a CAGR of 24.8% to reach USD 573.8 billion by 2034.
This shift in data center architecture is driving a major transformation in how organizations design and manage infrastructure. Instead of relying solely on rigid, hardware-driven models, businesses are now leaning into software-powered, agile, and scalable frameworks. The integration of AI, machine learning, and intent-based networking into SDDC solutions is rapidly evolving expectations. As a result, there is a growing demand for professionals who understand cross-domain technologies such as orchestration, virtualization, and cloud-native infrastructure. Advanced certifications and ongoing training are becoming essential for ensuring optimal performance and operational agility.
| Market Scope | |
|---|---|
| Start Year | 2024 |
| Forecast Year | 2025-2034 |
| Start Value | $70.6 Billion |
| Forecast Value | $573.8 Billion |
| CAGR | 24.8% |
The evolution of enterprise digital transformation, especially in tech-centric public-private collaborations, is fueling stronger momentum for SDDC adoption. Even before the pandemic, companies began transitioning from traditional hardware-bound models to virtualized, software-defined environments to reduce costs and boost flexibility. This shift has been most evident across sectors such as telecom, BFSI, and hyperscale cloud providers. While private and hybrid cloud models saw earlier traction, the pace of widespread deployment was previously held back by large upfront investment needs and a shortage of skilled experts. However, rapid advancements in automation and unified infrastructure management are helping eliminate these roadblocks.
In 2024, the software-defined networking (SDN) held a 43% share and is anticipated to grow at a CAGR of 23% through 2034. AI-based automation is radically transforming SDN by enabling real-time traffic control, predictive issue detection, and dynamic network configurations based on live workloads. As networks become more intelligent and self-configuring, enterprises are reducing downtime while increasing service performance across edge and multi-cloud setups. These advances are also helping reduce manual intervention while enhancing scalability and cybersecurity throughout the ecosystem.
The large enterprises segment held a 67% share in 2024 and is projected to grow at a 20% CAGR between 2025 and 2034. These businesses are leading the shift toward AI-integrated analytics that help optimize workloads, predict hardware issues, and enable autonomous infrastructure management. With real-time intelligence embedded across compute, storage, and networking components, enterprises are gaining agility and faster ROI. This level of smart resource allocation supports the flexibility needed to meet shifting business demands and scale without the limitations of legacy systems.
United States Software-Defined Data Center Market held a 90% share and generated USD 26 billion in 2024. The US dominance is driven by its widespread adoption of hybrid and multi-cloud models, active digital infrastructure development, and deep vendor ecosystems. The strong presence of enterprise-grade automation investments-especially among Fortune 500 firms-is also pushing this growth. Moreover, strategic collaborations between technology companies, educational institutions, and public sector initiatives are focusing on workforce development and digital modernization, enhancing the overall pace of adoption.
Major players in the Global Software-Defined Data Center Market include Nutanix, Cisco Systems, Oracle, Huawei, Microsoft, Dell Technologies, and Google. These companies are leading innovation across cloud-native infrastructure, virtualized environments, and AI-powered automation. Top companies in the Software-Defined Data Center Market are aggressively investing in AI-driven infrastructure orchestration, hybrid cloud enablement, and automated workload management tools to differentiate themselves. Many are enhancing interoperability with third-party cloud platforms to provide seamless integration across public and private environments. Strategic partnerships with academic institutions, government bodies, and cloud-native startups are helping to build a skilled workforce and accelerate technology deployment. Product development now focuses on containerization support, real-time analytics, and intent-based networking. In addition, players like Huawei, Microsoft, Google, Oracle, Cisco Systems, Dell Technologies, and Nutanix are prioritizing subscription-based models and expanding their SaaS portfolios to improve customer retention and long-term profitability.
Table of Contents
Chapter 1 Methodology
- 1.1 Market scope and definition
- 1.2 Research design
- 1.2.1 Research approach
- 1.2.2 Data collection methods
- 1.3 Data mining sources
- 1.3.1 Global
- 1.3.2 Regional/Country
- 1.4 Base estimates and calculations
- 1.4.1 Base year calculation
- 1.4.2 Key trends for market estimation
- 1.5 Primary research and validation
- 1.5.1 Primary sources
- 1.6 Forecast model
- 1.7 Research assumptions and limitations
Chapter 2 Executive Summary
- 2.1 Industry 3600 synopsis, 2021 - 2034
- 2.2 Key market trends
- 2.2.1 Regional
- 2.2.2 Solution
- 2.2.3 Organization size
- 2.2.4 End use
- 2.2.5 Deployment
- 2.2.6 Application
- 2.3 TAM Analysis, 2025-2034
- 2.4 CXO perspectives: Strategic imperatives
- 2.4.1 Executive decision points
- 2.4.2 Critical success factors
- 2.5 Future outlook and strategic recommendations
Chapter 3 Industry Insights
- 3.1 Industry ecosystem analysis
- 3.1.1 Supplier landscape
- 3.1.2 Profit margin analysis
- 3.1.3 Cost structure
- 3.1.4 Value addition at each stage
- 3.1.5 Factor affecting the value chain
- 3.1.6 Disruptions
- 3.2 Industry impact forces
- 3.2.1 Growth drivers
- 3.2.1.1 Demand for agile, scalable IT infrastructure
- 3.2.1.2 Integration of AI and automation
- 3.2.1.3 Hybrid and multi-cloud adoption
- 3.2.1.4 Data center virtualization growth
- 3.2.2 Industry pitfalls and challenges
- 3.2.2.1 High upfront investment
- 3.2.2.2 Security and compliance challenges
- 3.2.3 Market opportunities
- 3.2.3.1 Edge computing integration
- 3.2.3.2 Government-led digital infrastructure initiatives
- 3.2.3.3 Industry-specific SDDC solutions
- 3.2.3.4 Vendor-driven training and certification
- 3.2.1 Growth drivers
- 3.3 Growth potential analysis
- 3.4 Regulatory landscape
- 3.4.1 North America
- 3.4.2 Europe
- 3.4.3 Asia Pacific
- 3.4.4 Latin America
- 3.4.5 Middle East & Africa
- 3.5 Porter's analysis
- 3.6 PESTEL analysis
- 3.7 Patent analysis
- 3.8 Technology and Innovation landscape
- 3.8.1 Current technological trends
- 3.8.2 Emerging technologies
- 3.8.2.1 Artificial intelligence and machine learning integration
- 3.8.2.1.1 AI-powered SDDC management and orchestration
- 3.8.2.1.2 Machine learning for infrastructure automation
- 3.8.2.1.3 AIOps and intelligent operations
- 3.8.2.2 Edge computing and distributed SDDC
- 3.8.2.2.1 Edge SDDC architecture and design
- 3.8.2.2.2 5G and IoT integration
- 3.8.2.2.3 Edge use cases and applications
- 3.8.2.3 Container and Kubernetes evolution
- 3.8.2.3.1 Container-native SDDC platforms
- 3.8.2.3.2 Kubernetes orchestration and management
- 3.8.2.3.3 Service mesh and application connectivity
- 3.8.2.4 Quantum computing and next-generation technologies
- 3.8.2.4.1 Quantum computing integration with SDDC
- 3.8.2.4.2 Quantum-safe security and encryption
- 3.8.2.4.3 Quantum networking and communication
- 3.8.2.4.4 Hybrid classical-quantum computing
- 3.8.2.5 Sustainability and green computing
- 3.8.2.5.1 Energy-efficient SDDC design and operations
- 3.8.2.5.2 Carbon footprint reduction and optimization
- 3.8.2.5.3 Renewable energy integration
- 3.8.2.5.4 Circular economy and resource optimization
- 3.8.2.1 Artificial intelligence and machine learning integration
- 3.9 Price trends
- 3.9.1 By region
- 3.9.2 By product
- 3.9.2.1 Historical pricing analysis and market evolution (2019-2024)
- 3.9.2.1.1 Software licensing cost trends
- 3.9.2.1.1.1 Hypervisor and virtualization licensing
- 3.9.2.1.1.2 SDN controller and network software pricing
- 3.9.2.1.1.3 Storage virtualization software costs
- 3.9.2.1.1.4 Management and orchestration platform pricing
- 3.9.2.1.1.5 Enterprise license agreement (ELA) trends
- 3.9.2.1.2 Hardware cost impact and optimization
- 3.9.2.1.2.1 Server hardware cost per virtual machine
- 3.9.2.1.2.2 Storage hardware cost optimization
- 3.9.2.1.2.3 Network hardware reduction benefits
- 3.9.2.1.2.4 Commodity hardware vs proprietary solutions
- 3.9.2.1.2.5 Hardware refresh cycle optimization
- 3.9.2.1.3 Service and support pricing evolution
- 3.9.2.1.3.1 Professional services cost trends
- 3.9.2.1.3.2 Implementation and migration service pricing
- 3.9.2.1.3.3 Ongoing support and maintenance costs
- 3.9.2.1.3.4 Training and certification pricing
- 3.9.2.1.3.5 Managed services and outsourcing costs
- 3.9.2.1.1 Software licensing cost trends
- 3.9.2.2 Current SDDC pricing landscape (2024-2025)
- 3.9.2.2.1 Licensing model analysis and comparison
- 3.9.2.2.1.1 Perpetual vs subscription licensing
- 3.9.2.2.1.2 Per-socket vs per-core pricing models
- 3.9.2.2.1.3 Capacity-based pricing (per Tb, per Vm)
- 3.9.2.2.1.4 Usage-based and consumption pricing
- 3.9.2.2.1.5 Hybrid and multi-cloud pricing models
- 3.9.2.2.2 Regional pricing variations and analysis
- 3.9.2.2.3 Vendor pricing strategy analysis
- 3.9.2.2.4 Total cost of ownership (TCO) and ROI analysis
- 3.9.2.2.4.1 SDDC vs traditional infrastructure TCO
- 3.9.2.2.4.2 ROI calculation and business value
- 3.9.2.2.4.3 Cost optimization strategies
- 3.9.2.2.1 Licensing model analysis and comparison
- 3.9.2.3 Future pricing projections and market trends (2025-2034)
- 3.9.2.3.1 Short-term pricing forecast (1-2 years)
- 3.9.2.3.2 Medium-term pricing evolution (3-5 years)
- 3.9.2.3.3 Long-term price trends (5-10 years)
- 3.9.2.4 Cost-benefit analysis and financial modeling
- 3.9.2.4.1 Financial justification frameworks
- 3.9.2.4.2 Budget planning and allocation models
- 3.9.2.4.3 Cost center vs profit center analysis
- 3.9.2.4.4 Chargeback and show back models
- 3.9.2.4.5 Financial risk assessment and mitigation
- 3.9.2.1 Historical pricing analysis and market evolution (2019-2024)
- 3.10 Accelerated digital transformation scenario
- 3.10.1 Market size and growth projections
- 3.10.2 Technology adoption acceleration
- 3.10.3 Industry vertical expansion
- 3.10.4 Geographic market development
- 3.10.5 Investment and M&A activity
- 3.11 AI and automation revolution scenario
- 3.11.1 AI-driven SDDC management
- 3.11.2 Autonomous infrastructure operations
- 3.11.3 Intelligent workload optimization
- 3.11.4 Predictive analytics and maintenance
- 3.11.5 New service models and offerings
- 3.12 Edge computing proliferation scenario
- 3.12.1 Distributed SDDC architecture
- 3.12.2. 5 g and IoT integration
- 3.12.3 Real-time processing requirements
- 3.12.4 Edge-to-cloud orchestration
- 3.12.5 New market opportunities
- 3.13 Technology breakthrough scenarios
- 3.13.1 Quantum computing integration
- 3.13.2 Advanced AI and machine learning
- 3.13.3 Next-generation networking technologies
- 3.13.4 Sustainable and green computing
- 3.13.5 Immersive technologies (AR/VR/metaverse)
- 3.14 Regulatory and market evolution scenarios
- 3.14.1 Data sovereignty and localization requirements
- 3.14.2 Cybersecurity regulations and standards
- 3.14.3 Environmental and sustainability mandates
- 3.14.4 Industry consolidation and standardization
- 3.14.5 Open source and community-driven development
- 3.15 Strategic implications and recommendations
- 3.15.1 Technology investment strategies
- 3.15.2 Market entry and expansion planning
- 3.15.3 Partnership and ecosystem development
- 3.15.4 Innovation and R&D priorities
- 3.15.5 Risk mitigation and contingency planning
- 3.16 Case studies
- 3.16.1 Enterprise SDDC transformation case studies
- 3.16.2 Global manufacturing company digital transformation
- 3.16.3 Healthcare system SDDC and compliance
- 3.17 Success stories
- 3.17.1 SME and mid-market success stories
- 3.17.2 Government and public sector implementations
- 3.17.3 Industry-specific transformation cases
- 3.17.4 Energy efficiency and cost optimization cases
- 3.18 Use cases
- 3.19 Sustainability and environmental aspects
- 3.19.1 Sustainable practices
- 3.19.2 Waste reduction strategies
- 3.19.3 Energy efficiency in production
- 3.19.4 Eco-friendly Initiatives
- 3.19.5 Carbon footprint considerations
Chapter 4 Competitive Landscape, 2024
- 4.1 Introduction
- 4.2 Company market share analysis
- 4.2.1 North America
- 4.2.2 Europe
- 4.2.3 Asia Pacific
- 4.2.4 LATAM
- 4.2.5 MEA
- 4.3 Competitive analysis of major market players
- 4.4 Competitive positioning matrix
- 4.5 Strategic outlook matrix
- 4.6 Key developments
- 4.6.1 Mergers & acquisitions
- 4.6.2 Partnerships & collaborations
- 4.6.3 New Product launches
- 4.6.4 Expansion plans and funding
Chapter 5 Market Estimates & Forecast, By Solution, 2021 - 2034 ($Mn)
- 5.1 Key trends
- 5.2 Software-defined networking (SDN)
- 5.2.1 Hardware
- 5.2.2 Software
- 5.2.3 Services
- 5.2.3.1 Managed
- 5.2.3.2 Professional
- 5.3 Software-defined storage (SDS)
- 5.3.1 Hardware
- 5.3.2 Software
- 5.3.3 Services
- 5.3.3.1 Managed
- 5.3.3.2 Professional
- 5.4 Software-defined compute (SDC)
- 5.4.1 Hardware
- 5.4.2 Software
- 5.4.3 Services
- 5.4.3.1 Managed
- 5.4.3.2 Professional
Chapter 6 Market Estimates & Forecast, By Organization size, 2021 - 2034 ($Mn)
- 6.1 Key trends
- 6.2 SME
- 6.3 Large enterprises
Chapter 7 Market Estimates & Forecast, By End use, 2021 - 2034 ($Mn)
- 7.1 Key trends
- 7.2 BFSI
- 7.3 Retail and e-commerce
- 7.4 Government
- 7.5 Healthcare
- 7.6 Manufacturing
- 7.7 IT-enabled services
- 7.8 Others
Chapter 8 Market Estimates & Forecast, By Deployment, 2021 - 2034 ($Mn)
- 8.1 Key trends
- 8.2 On-premises
- 8.3 Public cloud
- 8.4 Private cloud
- 8.5 Hybrid cloud
Chapter 9 Market Estimates & Forecast, By Application, 2021 - 2034 ($Mn)
- 9.1 Key trends
- 9.2 Resource pooling & virtualization
- 9.3 Disaster recovery & business continuity
- 9.4 Data center consolidation
- 9.5 Dynamic resource allocation
- 9.6 DevOps and CI/CD automation
Chapter 10 Market Estimates & Forecast, By Region, 2021 - 2034 ($Mn)
- 10.1 Key trends
- 10.2 North America
- 10.2.1 US
- 10.2.2 Canada
- 10.3 Europe
- 10.3.1 Germany
- 10.3.2 UK
- 10.3.3 France
- 10.3.4 Italy
- 10.3.5 Spain
- 10.3.6 Nordics
- 10.3.7 Russia
- 10.4 Asia Pacific
- 10.4.1 China
- 10.4.2 India
- 10.4.3 Japan
- 10.4.4 Australia
- 10.4.5 South Korea
- 10.4.6 Southeast Asia
- 10.5 Latin America
- 10.5.1 Brazil
- 10.5.2 Mexico
- 10.5.3 Argentina
- 10.6 MEA
- 10.6.1 South Africa
- 10.6.2 Saudi Arabia
- 10.6.3 UAE
Chapter 11 Company Profiles
- 11.1 Global players
- 11.1.1 Advanced Systems Group
- 11.1.2 Cisco Systems
- 11.1.3 Citrix Systems
- 11.1.4 Dell Technologies
- 11.1.5 Equinix
- 11.1.6 Fujitsu
- 11.1.7 Hewlett Packard Enterprise (HPE)
- 11.1.8 Hitachi Data Systems
- 11.1.9 Huawei
- 11.1.10 IBM
- 11.1.11 Juniper
- 11.1.12 Microsoft
- 11.1.13 NEC Corporation of America
- 11.1.14 NetApp
- 11.1.15 Nutanix
- 11.1.16 Red Hat
- 11.1.17 VMware
- 11.2 Regional players
- 11.2.1 Cloudistics
- 11.2.2 DriveScale
- 11.2.3 Maxta
- 11.2.4 Nexenta Systems
- 11.2.5 Pluribus Networks
- 11.2.6 QTS Realty Trust
- 11.2.7 Rahi Systems
- 11.2.8 SUSE
- 11.2.9 Super Micro Computer
- 11.3 Emerging and specialist players
- 11.3.1 Atlantis Computing
- 11.3.2 Cloudistics
- 11.3.3 Maxta
- 11.4 Cloud and hyperscale players
- 11.4.1 Alibaba Cloud
- 11.4.2 Amazon Web Services (AWS)
- 11.4.3 Google
- 11.4.4 Huawei Technologies
- 11.4.5 Oracle

