
PUBLISHER: Global Market Insights Inc. | PRODUCT CODE: 1685074

PUBLISHER: Global Market Insights Inc. | PRODUCT CODE: 1685074
Industrial Sludge Dewatering Equipment Market Opportunity, Growth Drivers, Industry Trend Analysis, and Forecast 2025 - 2034
The Global Industrial Sludge Dewatering Equipment Market, valued at USD 1.2 billion in 2024, is projected to grow at a robust CAGR of 8.8% between 2025 and 2034, driven by rapid industrialization and the increasing need for efficient wastewater management solutions. This surge is fueled by businesses implementing advanced dewatering technologies to comply with stringent environmental regulations while optimizing operational efficiency. The growing focus on sustainable waste management practices is pushing companies to innovate, aiming to reduce sludge volume, recover valuable resources, and minimize disposal costs.
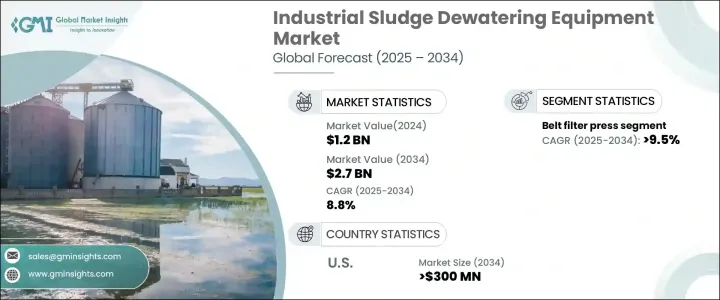
With an increasing demand for modular and scalable sludge dewatering systems, the market is expected to generate USD 2.7 billion by 2034. Companies across industries are realizing the financial and environmental benefits of effective sludge management, including lower landfill dependency and substantial cost reductions. Additionally, integrating resource recovery technologies, such as nutrient extraction and biogas generation, is gaining traction. Businesses are prioritizing solutions that align with sustainability initiatives, enhance regulatory compliance, and improve overall profitability.
| Market Scope | |
|---|---|
| Start Year | 2024 |
| Forecast Year | 2025-2034 |
| Start Value | $1.2 Billion |
| Forecast Value | $2.7 Billion |
| CAGR | 8.8% |
A strong emphasis on reducing environmental impact has led industries to adopt cutting-edge dewatering technologies. Traditional sludge disposal methods are becoming obsolete due to limited landfill space and escalating disposal costs. Companies are now investing in high-efficiency dewatering solutions that enable better sludge handling and resource optimization. Government regulations worldwide continue to tighten, compelling industries to adopt innovative strategies that ensure compliance while maintaining cost-effectiveness. The market is witnessing a shift toward automation and smart monitoring, further enhancing the efficiency of dewatering processes.
Among the various technologies used in industrial sludge dewatering, the belt filter press segment is set to grow at a CAGR of 9.5% through 2034. This technology stands out due to its superior mechanical dewatering capabilities, which significantly lower sludge disposal costs. By utilizing a series of rollers, belt filter presses optimize water extraction and improve sludge consistency. Their effectiveness makes them a preferred choice for industries aiming to comply with evolving wastewater treatment standards. Heightened regulatory scrutiny over industrial waste disposal and the shrinking availability of landfill space continues to drive the demand for belt filter press technology.
The U.S. industrial sludge dewatering equipment market is forecast to generate USD 300 million by 2034, driven by the urgent need for effective sludge management solutions across key industries. Businesses are increasingly deploying advanced dewatering technologies, such as centrifuges and screw presses, to handle large volumes of sludge efficiently. With growing awareness of environmental sustainability and stricter government regulations, industries are rapidly transitioning to innovative dewatering methods. The push toward sustainable operations is fueling the adoption of cutting-edge sludge treatment solutions, ensuring long-term compliance and cost savings for businesses nationwide.
Table of Contents
Chapter 1 Methodology & Scope
- 1.1 Market scope & definitions
- 1.2 Market estimates & forecast parameters
- 1.3 Forecast calculation
- 1.4 Data sources
- 1.4.1 Primary
- 1.4.2 Secondary
- 1.4.2.1 Paid
- 1.4.2.2 Public
Chapter 2 Executive Summary
- 2.1 Industry synopsis, 2021 - 2034
Chapter 3 Industry Insights
- 3.1 Industry ecosystem analysis
- 3.2 Regulatory landscape
- 3.3 Industry impact forces
- 3.3.1 Growth drivers
- 3.3.2 Industry pitfalls & challenges
- 3.4 Growth potential analysis
- 3.5 Porter's analysis
- 3.5.1 Bargaining power of suppliers
- 3.5.2 Bargaining power of buyers
- 3.5.3 Threat of new entrants
- 3.5.4 Threat of substitutes
- 3.6 PESTEL analysis
Chapter 4 Competitive Landscape, 2024
- 4.1 Introduction
- 4.2 Strategic outlook
- 4.3 Innovation & sustainability landscape
Chapter 5 Market Size and Forecast, By Technology, 2021 – 2034 (USD Billion)
- 5.1 Key trends
- 5.2 Belt filter press
- 5.3 Centrifuges
- 5.4 Screw press
- 5.5 Others
Chapter 6 Market Size and Forecast, By Region, 2021 – 2034 (USD Billion)
- 6.1 Key trends
- 6.2 North America
- 6.2.1 U.S.
- 6.2.2 Canada
- 6.2.3 Mexico
- 6.3 Europe
- 6.3.1 Germany
- 6.3.2 UK
- 6.3.3 France
- 6.3.4 Italy
- 6.3.5 Spain
- 6.4 Asia Pacific
- 6.4.1 China
- 6.4.2 India
- 6.4.3 Japan
- 6.4.4 South Korea
- 6.5 Middle East & Africa
- 6.5.1 Saudi Arabia
- 6.5.2 South Africa
- 6.6 Latin America
- 6.6.1 Brazil
- 6.6.2 Argentina
Chapter 7 Company Profiles
- 7.1 Alfa Laval
- 7.2 Andritz
- 7.3 Aqseptence Group
- 7.4 Encon Evaporators
- 7.5 Evoqua Water Technologies
- 7.6 Flotrend
- 7.7 Hiller Separation & Process
- 7.8 Hitachi Zosen
- 7.9 Huber
- 7.10 Keppel Seghers
- 7.11 Komline-Sanderson
- 7.12 Kontek Ecology Systems
- 7.13 Phoenix Process Equipment
- 7.14 Sebright Products
- 7.15 Veolia

