
PUBLISHER: Global Market Insights Inc. | PRODUCT CODE: 1667156

PUBLISHER: Global Market Insights Inc. | PRODUCT CODE: 1667156
Vegetal Natural Fiber Market Opportunity, Growth Drivers, Industry Trend Analysis, and Forecast 2025 - 2034
The Global Vegetal Natural Fiber Market, valued at USD 5.5 billion in 2024, is projected to experience a CAGR of 7.2% from 2025 to 2034. These fibers, derived from plant sources such as cotton, jute, hemp, flax, sisal, and coconut, offer an eco-conscious alternative to synthetic materials. Known for their strength, versatility, and biodegradable nature, these fibers are increasingly sought after across industries aiming to adopt sustainable practices. As environmental awareness grows, so does the demand for natural fibers in textiles, automotive components, and building materials. Consumers are favoring products made with natural fibers due to their organic properties and minimal environmental impact. This trend reflects a broader shift toward adopting environmentally friendly solutions and sustainable materials in various applications.
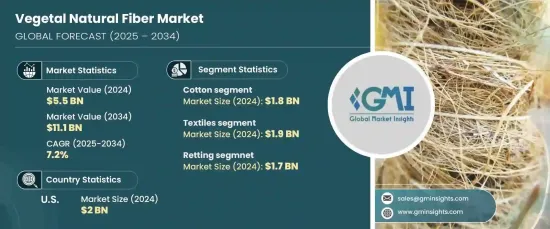
The cotton segment accounted for USD 1.8 billion in 2024 and is forecasted to grow at a CAGR of 7.2%. Other vegetal fibers such as jute, hemp, flax, sisal, and coconut are gaining traction in markets driven by their sustainability and functionality. The demand for jute and hemp is increasing in industries like packaging and construction, while flax finds use in home furnishings. Sisal and coconut fibers are also witnessing expansion due to their utility in industrial and agricultural applications.
| Market Scope | |
|---|---|
| Start Year | 2024 |
| Forecast Year | 2025-2034 |
| Start Value | $5.5 Billion |
| Forecast Value | $11.1 Billion |
| CAGR | 7.2% |
In terms of application, the textiles sector held USD 1.9 billion in 2024 and is projected to expand at a CAGR of 6.3% through the forecast period. Vegetal natural fibers are being integrated into diverse industries, from automotive to agriculture, owing to their unique properties. In the automotive sector, these fibers contribute to lightweight and sustainable interior components. Construction applications are also embracing vegetal fibers for eco-friendly composite materials. Packaging solutions increasingly use these fibers to meet the growing demand for sustainability, while agricultural uses include soil conditioning and erosion control.
Processing methods play a significant role in transforming raw vegetal fibers into usable materials. Retting, a common process valued at USD 1.7 billion in 2024 and expected to grow at a CAGR of 6.1%, involves soaking plant fibers in water to separate them from woody parts. Other methods like decortication and spinning are critical in producing clean, high-quality fibers, which are then woven or knitted into various fabric forms.
The U.S. vegetal natural fiber market, valued at USD 2 billion in 2024, is expected to grow at a 6.5% CAGR through 2034. This growth is fueled by the country's economic strength, innovative industrial sector, and strategic focus on sustainability and consumer trends. Favorable policies and advanced infrastructure further position the U.S. as a leader in the North American market.
Table of Contents
Chapter 1 Methodology & Scope
- 1.1 Market scope & definitions
- 1.2 Base estimates & calculations
- 1.3 Forecast calculations
- 1.4 Data sources
- 1.4.1 Primary
- 1.4.2 Secondary
- 1.4.2.1 Paid sources
- 1.4.2.2 Public sources
Chapter 2 Executive Summary
- 2.1 Industry synopsis, 2021-2034
Chapter 3 Industry Insights
- 3.1 Industry ecosystem analysis
- 3.1.1 Factor affecting the value chain
- 3.1.2 Profit margin analysis
- 3.1.3 Disruptions
- 3.1.4 Future outlook
- 3.1.5 Manufacturers
- 3.1.6 Distributors
- 3.2 Supplier landscape
- 3.3 Profit margin analysis
- 3.4 Key news & initiatives
- 3.5 Regulatory landscape
- 3.6 Impact forces
- 3.6.1 Growth drivers
- 3.6.1.1 Increasing demand for sustainable materials
- 3.6.1.2 Expanding textile and fashion industry
- 3.6.1.3 Automotive industry adoption
- 3.6.2 Industry pitfalls & challenges
- 3.6.2.1 Limited awareness and education
- 3.6.1 Growth drivers
- 3.7 Growth potential analysis
- 3.8 Porter’s analysis
- 3.9 PESTEL analysis
Chapter 4 Competitive Landscape, 2024
- 4.1 Introduction
- 4.2 Company market share analysis
- 4.3 Competitive positioning matrix
- 4.4 Strategic outlook matrix
Chapter 5 Market Estimates & Forecast, By Product, 2021-2034 (USD Million) (Tons)
- 5.1 Key trends
- 5.2 Cotton fibers
- 5.3 Jute fibers
- 5.4 Hemp fibers
- 5.5 Flax fibers (linens)
- 5.6 Sisal fibers
- 5.7 Coconut fibers (coir)
Chapter 6 Market Estimates & Forecast, By Application, 2021-2034 (USD Million) (Tons)
- 6.1 Key trends
- 6.2 Textiles
- 6.3 Automotive industry
- 6.4 Construction materials
- 6.5 Packaging
- 6.6 Agricultural and horticultural applications
- 6.7 Geotextiles
Chapter 7 Market Estimates & Forecast, By Processing Methods, 2021-2034 (USD Million) (Tons)
- 7.1 Key trends
- 7.2 Retting
- 7.3 Decortication
- 7.4 Spinning
- 7.5 Weaving and knitting
- 7.6 Composite manufacturing
Chapter 8 Market Estimates & Forecast, By Region, 2021-2034 (USD Million) (Tons)
- 8.1 Key trends
- 8.2 North America
- 8.2.1 U.S.
- 8.2.2 Canada
- 8.3 Europe
- 8.3.1 UK
- 8.3.2 Germany
- 8.3.3 France
- 8.3.4 Italy
- 8.3.5 Spain
- 8.3.6 Russia
- 8.4 Asia Pacific
- 8.4.1 China
- 8.4.2 India
- 8.4.3 Japan
- 8.4.4 South Korea
- 8.4.5 Australia
- 8.5 Latin America
- 8.5.1 Brazil
- 8.5.2 Mexico
- 8.6 MEA
- 8.6.1 South Africa
- 8.6.2 Saudi Arabia
- 8.6.3 UAE
Chapter 9 Company Profiles
- 9.1 Aditya Birla Group
- 9.2 Antex
- 9.3 Golden Peacock Group
- 9.4 Kelheim Fibres
- 9.5 Lenzing
- 9.6 Nufarm
- 9.7 Safilens
- 9.8 Sateri Holdings
- 9.9 Shandong Jilin Chemical Fiber
- 9.10 Shandong Ruyi Textile Group
- 9.11 Shanghai Chemical Industries
- 9.12 Shenglong Group
- 9.13 Suominen Oyj
- 9.14 Thai Rayon PCL
- 9.15 Zhejiang Huafu Chemical Fiber

