
PUBLISHER: Global Market Insights Inc. | PRODUCT CODE: 1667085

PUBLISHER: Global Market Insights Inc. | PRODUCT CODE: 1667085
Contactor Based Transfer Switch Market Opportunity, Growth Drivers, Industry Trend Analysis, and Forecast 2025 - 2034
The Global Contactor Based Transfer Switch Market was valued at USD 1.2 billion in 2024 and is projected to experience a steady growth rate of 5.2% CAGR from 2025 to 2034. This growth is largely driven by an increasing demand for reliable power backup solutions, with power outages becoming more frequent and unpredictable due to aging infrastructure and environmental factors. The market is evolving as both industries and residential sectors recognize the need for efficient power transfer systems that ensure continuity in operations. With a rapidly expanding need for energy resilience, particularly in critical facilities, the contactor-based transfer switch market has emerged as a key player in providing uninterrupted electricity supply across various applications.
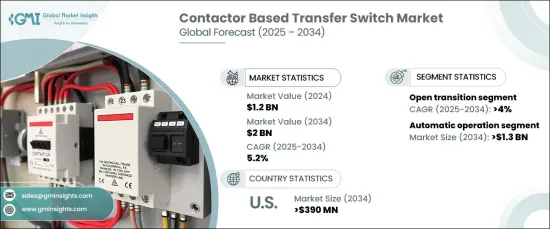
The market is segmented into several types, such as automatic operation and open transition contactor-based transfer switches. The automatic operation segment is expected to generate USD 1.3 billion by 2034. This significant growth is attributed to the rising need for seamless and uninterrupted power transfer in industries where reliability is paramount. Automatic transfer switches (ATS) are becoming indispensable in facilities like healthcare centers, data centers, and manufacturing plants. Their ability to detect power interruptions and switch to backup sources without requiring manual intervention has made them crucial in these high-priority sectors.
| Market Scope | |
|---|---|
| Start Year | 2024 |
| Forecast Year | 2025-2034 |
| Start Value | $1.2 Billion |
| Forecast Value | $2 Billion |
| CAGR | 5.2% |
The open transition transfer switches segment is also expected to experience robust growth, with a forecasted CAGR of 4% through 2034. These switches are popular for their cost-effectiveness, ease of operation, and dependability. Open transition switches are typically used in less critical applications, such as commercial buildings and light industrial setups, where a momentary power interruption is acceptable. As more regions face grid instability and frequent power outages, the demand for backup power systems, including open transition transfer switches, is on the rise.
In the U.S., the contactor-based transfer switch market is anticipated to generate USD 390 million by 2034. This surge is driven by the growing need for reliable power systems in residential, commercial, and industrial sectors. The aging power grid, along with increasing instances of power interruptions, is accelerating the adoption of transfer switches in these sectors. The integration of renewable energy sources and the rise of distributed energy resources are further boosting market demand, as these technologies require advanced and efficient solutions for power transfer. As power backup becomes an essential part of modern infrastructure, the demand for transfer switches will continue to grow in response to these shifting energy landscapes.
Table of Contents
Chapter 1 Methodology & Scope
- 1.1 Market definitions
- 1.2 Base estimates & calculations
- 1.3 Forecast calculation
- 1.4 Data sources
- 1.4.1 Primary
- 1.4.2 Secondary
- 1.4.2.1 Paid
- 1.4.2.2 Public
Chapter 2 Executive Summary
- 2.1 Industry synopsis, 2021 - 2034
Chapter 3 Industry Insights
- 3.1 Industry ecosystem analysis
- 3.2 Regulatory landscape
- 3.3 Industry impact forces
- 3.3.1 Growth drivers
- 3.3.2 Industry pitfalls & challenges
- 3.4 Growth potential analysis
- 3.5 Porter's analysis
- 3.5.1 Bargaining power of suppliers
- 3.5.2 Bargaining power of buyers
- 3.5.3 Threat of new entrants
- 3.5.4 Threat of substitutes
- 3.6 PESTEL analysis
Chapter 4 Competitive Landscape, 2024
- 4.1 Strategic dashboard
- 4.2 Innovation & sustainability landscape
Chapter 5 Market Size and Forecast, By Operations, 2021 – 2034 (‘000 Units, USD Million)
- 5.1 Key trends
- 5.2 Manual
- 5.3 Non-automatic
- 5.4 Automatic
- 5.5 By-pass isolation
Chapter 6 Market Size and Forecast, By Transition, 2021 – 2034 (‘000 Units, USD Million)
- 6.1 Key trends
- 6.2 Closed
- 6.3 Open
Chapter 7 Market Size and Forecast, By Installation, 2021 – 2034 (‘000 Units, USD Million)
- 7.1 Key trends
- 7.2 Emergency systems
- 7.3 Legally required systems
- 7.4 Critical operations power systems
- 7.5 Optional standby systems
Chapter 8 Market Size and Forecast, By Region, 2021 – 2034 (‘000 Units, USD Million)
- 8.1 Key trends
- 8.2 North America
- 8.2.1 U.S.
- 8.2.2 Canada
- 8.2.3 Mexico
- 8.3 Europe
- 8.3.1 Germany
- 8.3.2 France
- 8.3.3 Russia
- 8.3.4 UK
- 8.3.5 Italy
- 8.3.6 Spain
- 8.4 Asia Pacific
- 8.4.1 Japan
- 8.4.2 South Korea
- 8.4.3 India
- 8.4.4 Australia
- 8.5 Middle East & Africa
- 8.5.1 UAE
- 8.5.2 South Africa
- 8.5.3 Saudi Arabia
- 8.6 Latin America
- 8.6.1 Brazil
- 8.6.2 Argentina
Chapter 9 Company Profiles
- 9.1 ABB
- 9.2 AEG Power Solutions
- 9.3 Blue Square Group
- 9.4 Briggs & Stratton
- 9.5 Caterpillar
- 9.6 Cummins
- 9.7 Eaton
- 9.8 Generac Power Systems
- 9.9 General Electric
- 9.10 Kohler
- 9.11 Midwest Electric Products
- 9.12 One Two Three Electric
- 9.13 Peterson
- 9.14 Schneider Electric
- 9.15 Siemens
- 9.16 Taylor Power Systems
- 9.17 Vertiv Group

