
PUBLISHER: Global Market Insights Inc. | PRODUCT CODE: 1766343

PUBLISHER: Global Market Insights Inc. | PRODUCT CODE: 1766343
Commercial Distribution Panel Market Opportunity, Growth Drivers, Industry Trend Analysis, and Forecast 2025 - 2034
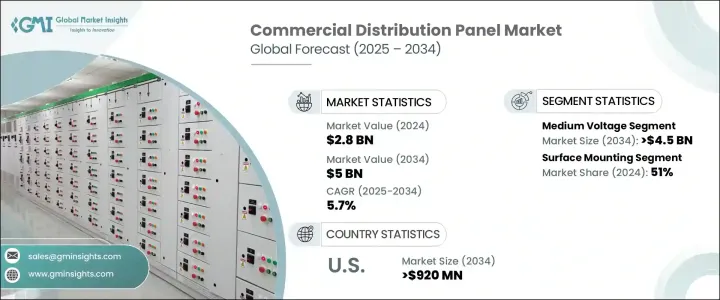
The Global Commercial Distribution Panel Market was valued at USD 2.8 billion in 2024 and is estimated to grow at a CAGR of 5.7% to reach USD 5 billion by 2034. This growth is driven by the rising need for efficient energy distribution systems in commercial infrastructure. This growth is largely fueled by the expanding urban landscape and rapid development of commercial facilities, especially in emerging economies. Businesses are placing greater emphasis on streamlined energy usage and reliable power control, which in turn is elevating the demand for advanced distribution solutions.
As cities grow and commercial buildings multiply, power distribution systems are evolving to become more robust and adaptable. The commercial sector is increasingly adopting smart technologies that allow for real-time energy monitoring and enhanced operational efficiency. Automated systems, intelligent fault detection, and remote supervision are no longer optional-they are becoming essential features in new installations. These innovations reflect a broader shift toward smarter energy management practices across various industries. Companies are prioritizing energy-efficient designs and digital connectivity to meet the modern expectations of commercial property developers, facility managers, and tenants.
| Market Scope | |
|---|---|
| Start Year | 2024 |
| Forecast Year | 2025-2034 |
| Start Value | $2.8 Billion |
| Forecast Value | $5 Billion |
| CAGR | 5.7% |
In parallel, regulatory frameworks focused on energy efficiency and environmental compliance are influencing the overall market dynamics. Businesses are adapting to these evolving standards by investing in panels that not only distribute energy effectively but also contribute to sustainability goals. Rising expectations around building performance and safety standards are also prompting upgrades to older systems. As a result, energy infrastructure across commercial properties is undergoing rapid transformation, supported by continuous product development and standardization.
Changing supply chain landscapes and shifting regional policies are prompting companies to rethink pricing strategies and distribution channels. These external influences are encouraging market players to form strategic alliances, engage in mergers, and expand their global reach. Such moves are crucial for enhancing their presence in growing markets and for addressing complex, region-specific energy distribution needs.
Among product types, the medium voltage segment holds significant growth potential and is projected to surpass USD 4.5 billion by 2034. This segment's rise can be attributed to the increasing number of commercial buildings, manufacturing facilities, and data centers requiring reliable and high-capacity power distribution. As these facilities incorporate sophisticated machinery and digital infrastructure, the need for medium voltage panels that offer precise energy control and safety becomes even more vital. The integration of Internet of Things (IoT) capabilities and smart grid compatibility is also strengthening this segment's relevance, as it allows operators to remotely monitor and optimize energy performance in real time.
Installation types continue to shape demand trends across the market. Surface-mounted distribution panels accounted for approximately 51% of global market share in 2024 and are expected to grow at a rate of more than 5% through 2034. These panels are favored for their straightforward installation and accessibility, particularly in industrial and utility settings. They offer practical benefits in scenarios where retrofitting or frequent maintenance is required, making them a preferred choice for commercial facilities aiming for minimal disruption and ease of access.
Regionally, the United States remains a key market for commercial distribution panels. The U.S. market was valued at USD 502.2 million in 2022, USD 541.2 million in 2023, and USD 579.6 million in 2024. By 2034, it is anticipated to exceed USD 920 million. This growth is supported by increased investments in smart buildings, upgrades to aging electrical systems, and the broader shift toward energy-efficient commercial spaces. As building automation and digital surveillance systems gain traction, the need for intelligent and responsive distribution panels continues to grow.
In terms of market competition, a small group of companies dominates global sales. In 2024, the top five manufacturers-Schneider Electric, Siemens, ABB, Eaton, and Legrand-accounted for more than 35% of the overall market. These companies maintain strong market positions due to their technological innovation, reliability, and established customer relationships. Their ability to deliver customized solutions tailored to complex commercial requirements further strengthens their standing in the global market. As the industry evolves, these players are expected to lead the way in offering smart, scalable, and future-ready distribution systems.
Table of Contents
Chapter 1 Methodology & Scope
- 1.1 Market definitions
- 1.2 Base estimates & calculations
- 1.3 Forecast calculation
- 1.4 Data sources
- 1.4.1 Primary
- 1.4.2 Secondary
- 1.4.2.1 Paid
- 1.4.2.2 Public
Chapter 2 Executive Summary
- 2.1 Industry synopsis, 2021 - 2034
Chapter 3 Industry Insights
- 3.1 Industry ecosystem analysis
- 3.2 Regulatory landscape
- 3.3 Industry impact forces
- 3.3.1 Growth drivers
- 3.3.2 Industry pitfalls & challenges
- 3.4 Growth potential analysis
- 3.5 Porter's analysis
- 3.5.1 Bargaining power of suppliers
- 3.5.2 Bargaining power of buyers
- 3.5.3 Threat of new entrants
- 3.5.4 Threat of substitutes
- 3.6 PESTEL analysis
Chapter 4 Competitive landscape, 2025
- 4.1 Introduction
- 4.2 Company market share analysis, 2024
- 4.3 Strategic initiatives
- 4.4 Strategic dashboard
- 4.5 Competitive benchmarking
- 4.6 Innovation & technology landscape
Chapter 5 Market Size and Forecast, By Voltage, 2021 - 2034 (USD Million)
- 5.1 Key trends
- 5.2 Low voltage
- 5.3 Medium voltage
Chapter 6 Market Size and Forecast, By Mounting, 2021 - 2034 (USD Million)
- 6.1 Key trends
- 6.2 Flush mounting
- 6.3 Surface mounting
Chapter 7 Market Size and Forecast, By End Use, 2021 - 2034 (USD Million)
- 7.1 Key trends
- 7.2 College/university
- 7.3 Office
- 7.4 Government/military
- 7.5 Others
Chapter 8 Market Size and Forecast, By Region, 2021 - 2034 (USD Million)
- 8.1 Key trends
- 8.2 North America
- 8.2.1 U.S.
- 8.2.2 Canada
- 8.3 Europe
- 8.3.1 UK
- 8.3.2 France
- 8.3.3 Germany
- 8.3.4 Russia
- 8.3.5 Italy
- 8.4 Asia Pacific
- 8.4.1 China
- 8.4.2 Australia
- 8.4.3 India
- 8.4.4 Japan
- 8.4.5 South Korea
- 8.5 Middle East & Africa
- 8.5.1 Saudi Arabia
- 8.5.2 UAE
- 8.5.3 Qatar
- 8.5.4 South Africa
- 8.5.5 Egypt
- 8.6 Latin America
- 8.6.1 Brazil
- 8.6.2 Argentina
- 8.6.3 Mexico
Chapter 9 Company Profiles
- 9.1 ABB
- 9.2 Abunayyan Holding
- 9.3 Ags
- 9.4 Alfanar
- 9.5 CSE Solutions
- 9.6 Eaton
- 9.7 EAMFCO
- 9.8 ESL Power Systems
- 9.9 General Electric
- 9.10 Hager
- 9.11 Industrial Electric MFG
- 9.12 Larsen & Toubro
- 9.13 Legrand
- 9.14 Meba Electric
- 9.15 NHP
- 9.16 Norelco
- 9.17 Paneltronics
- 9.18 RBaker
- 9.19 Schneider Electric
- 9.20 Siemens
- 9.21 Symbiotic Systems

