
PUBLISHER: Global Market Insights Inc. | PRODUCT CODE: 1741000

PUBLISHER: Global Market Insights Inc. | PRODUCT CODE: 1741000
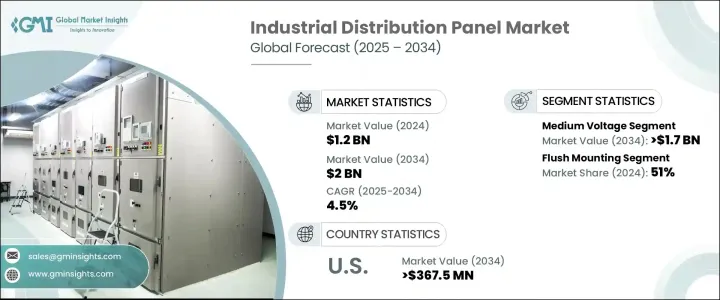
Industrial Distribution Panel Market Opportunity, Growth Drivers, Industry Trend Analysis, and Forecast 2025 - 2034
The Global Industrial Distribution Panel Market was valued at USD 1.2 billion in 2024 and is estimated to grow at a CAGR of 4.5% to reach USD 2 billion by 2034, driven by the accelerating adoption of automation control systems and smart energy management technologies. Rising investments across manufacturing, infrastructure, and energy sectors are fueling the demand for safer, more efficient electrical distribution solutions. As industries continue to modernize, there is a growing reliance on integrated, digitally enabled panels that offer real-time monitoring, proactive maintenance, and enhanced energy optimization. Advancements in smart grid technology, coupled with a global push for renewable energy integration, are reshaping the landscape for industrial distribution panels. The market is also benefiting from a surge in industrial automation, urbanization projects, and regulatory pressures to boost energy efficiency. With industries increasingly demanding customized, modular systems that can seamlessly integrate with hybrid power sources, the industrial distribution panel sector is positioned for sustained long-term growth.
The market dynamics are heavily influenced by evolving safety regulations, rapid technological innovation, and the need for more resilient infrastructure. Companies are integrating digital monitoring tools into traditional panels, offering end-users better performance visibility and reduced operational downtime. As digital transformation intensifies, the competitive environment continues to heat up. Key players are aggressively pursuing strategies to expand their global footprint and enhance their technical capabilities. Established companies are leveraging mergers and acquisitions to access new markets, incorporate specialized technologies, and broaden their service portfolios. New product development is prioritizing modular configurations, enabling faster installation and easier customization to meet diverse operational requirements.
| Market Scope | |
|---|---|
| Start Year | 2024 |
| Forecast Year | 2025-2034 |
| Start Value | $1.2 Billion |
| Forecast Value | $2 Billion |
| CAGR | 4.5% |
Emerging trends in the market are centered around real-time diagnostics that support continuous system monitoring and proactive maintenance through digital interfaces. This evolution is significantly improving system performance and minimizing downtime. Another major development includes the integration of renewable energy management capabilities into panel systems, enabling seamless incorporation of solar, wind, or hybrid power sources.
The medium voltage segment is poised to generate USD 1.7 billion by 2034, propelled by the adoption of smart grid technologies and automated systems for real-time energy management. Growing emphasis on sustainability is also promoting the rise of green switchgear solutions that help reduce carbon emissions. Meanwhile, heightened industrial and infrastructure activities across developing countries are further accelerating the need for reliable and efficient medium-voltage distribution panels.
The flush mounting segment held a 51% share in 2024 and is anticipated to grow at a CAGR of 5% through 2034. Flush mounting panels, which fit seamlessly within walls and conserve space, are increasingly favored in modern commercial and residential designs. Innovations in materials and modular designs are further enhancing installation and maintenance adaptability. Surface mounting panels, offering ease of installation and cost benefits, remain ideal for industrial settings requiring high accessibility and robust functionality.
United States Industrial Distribution Panel Market generated USD 258.6 million in 2024 and is projected to reach USD 367.5 million by 2034. Expanding adoption of intelligent technologies, energy efficiency measures, and renewable energy sources is powering the market. The implementation of IoT, automation, and modular systems is maximizing space utilization and operational efficiency, further supported by favorable government policies focused on innovation and sustainable development.
Key companies operating in the Global Industrial Distribution Panel Market include ABB, Eaton, General Electric, Legrand, Schneider Electric, Siemens, Hager Group, and Larsen & Toubro Limited. These companies are strengthening their market positions through strategic initiatives such as product innovation, mergers and acquisitions, and global expansion. For example, Schneider Electric has integrated advanced digital solutions into its distribution panels to boost energy management capabilities, while Eaton has been heavily investing in smart distribution technologies to improve operational efficiency and support sustainability goals. These strategic efforts are enabling companies to meet the evolving demands of the market and maintain a competitive advantage.
Table of Contents
Chapter 1 Methodology & Scope
- 1.1 Market definitions
- 1.2 Base estimates & calculations
- 1.3 Forecast calculation
- 1.4 Data sources
- 1.4.1 Primary
- 1.4.2 Secondary
- 1.4.2.1 Paid
- 1.4.2.2 Public
Chapter 2 Executive Summary
- 2.1 Industry synopsis, 2021 - 2034
Chapter 3 Industry Insights
- 3.1 Industry ecosystem analysis
- 3.2 Trump administration tariff analysis
- 3.2.1 Impact on trade
- 3.2.1.1 Trade volume disruptions
- 3.2.1.2 Retaliatory measures
- 3.2.2 Impact on the industry
- 3.2.2.1 Supply-side impact (raw materials)
- 3.2.2.1.1 Price volatility in key materials
- 3.2.2.1.2 Supply chain restructuring
- 3.2.2.1.3 Production cost implications
- 3.2.2.2 Demand-side impact (selling price)
- 3.2.2.2.1 Price transmission to end markets
- 3.2.2.2.2 Market share dynamics
- 3.2.2.2.3 Consumer response patterns
- 3.2.2.1 Supply-side impact (raw materials)
- 3.2.3 Key companies impacted
- 3.2.4 Strategic industry responses
- 3.2.4.1 Supply chain reconfiguration
- 3.2.4.2 Pricing and product strategies
- 3.2.4.3 Policy engagement
- 3.2.5 Outlook and future considerations
- 3.2.1 Impact on trade
- 3.3 Regulatory landscape
- 3.4 Industry impact forces
- 3.4.1 Growth drivers
- 3.4.2 Industry pitfalls & challenges
- 3.5 Growth potential analysis
- 3.6 Porter's analysis
- 3.6.1 Bargaining power of suppliers
- 3.6.2 Bargaining power of buyers
- 3.6.3 Threat of new entrants
- 3.6.4 Threat of substitutes
- 3.7 PESTEL analysis
Chapter 4 Competitive landscape, 2024
- 4.1 Strategic dashboard
- 4.2 Innovation & sustainability landscape
Chapter 5 Market Size and Forecast, By Voltage, 2021 - 2034 (USD Million)
- 5.1 Key trends
- 5.2 Low voltage
- 5.3 Medium voltage
Chapter 6 Market Size and Forecast, By Mounting, 2021 - 2034 (USD Million)
- 6.1 Key trends
- 6.2 Flush mounting
- 6.3 Surface mounting
Chapter 7 Market Size and Forecast, By End Use, 2021 - 2034 (USD Million)
- 7.1 Key trends
- 7.2 Power generation
- 7.3 Chemical
- 7.4 Refinery
- 7.5 Cement
- 7.6 Others
Chapter 8 Market Size and Forecast, By Region, 2021 - 2034 (USD Million)
- 8.1 Key trends
- 8.2 North America
- 8.2.1 U.S.
- 8.2.2 Canada
- 8.3 Europe
- 8.3.1 UK
- 8.3.2 France
- 8.3.3 Germany
- 8.3.4 Russia
- 8.3.5 Italy
- 8.4 Asia Pacific
- 8.4.1 China
- 8.4.2 Australia
- 8.4.3 India
- 8.4.4 Japan
- 8.4.5 South Korea
- 8.5 Middle East & Africa
- 8.5.1 Saudi Arabia
- 8.5.2 UAE
- 8.5.3 Qatar
- 8.5.4 South Africa
- 8.5.5 Egypt
- 8.6 Latin America
- 8.6.1 Brazil
- 8.6.2 Argentina
- 8.6.3 Mexico
Chapter 9 Company Profiles
- 9.1 ABB
- 9.2 Ags
- 9.3 alfanar Group
- 9.4 CSE Solutions Pvt. Ltd.
- 9.5 EAMFCO
- 9.6 Eaton
- 9.7 ESL POWER SYSTEMS, INC.
- 9.8 General Electric
- 9.9 Hager Group
- 9.10 INDUSTRIAL ELECTRIC MFG
- 9.11 Larsen & Toubro Limited
- 9.12 Legrand
- 9.13 Meba Electric Co., Ltd
- 9.14 NHP
- 9.15 Norelco
- 9.16 Paneltronics
- 9.17 RBaker
- 9.18 Schneider Electric
- 9.19 Siemens
- 9.20 Symbiotic Systems

