
PUBLISHER: Global Market Insights Inc. | PRODUCT CODE: 1716642

PUBLISHER: Global Market Insights Inc. | PRODUCT CODE: 1716642
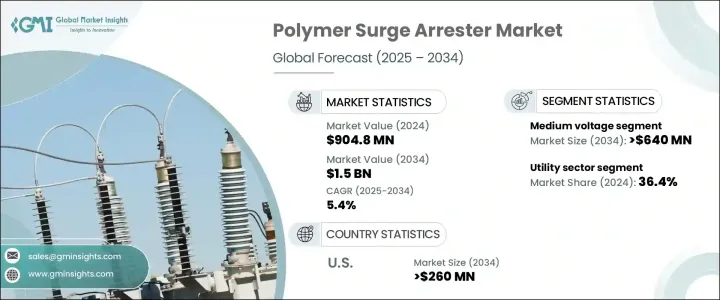
Polymer Surge Arrester Market Opportunity, Growth Drivers, Industry Trend Analysis, and Forecast 2025 - 2034
The Global Polymer Surge Arrester Market reached USD 904.8 million in 2024 and is expected to expand at a CAGR of 5.4% between 2025 and 2034. The increasing demand for cost-effective and reliable surge protection solutions across diverse industries is fueling this growth. As power infrastructures become more advanced, the necessity for high-performance surge arresters is intensifying. The rise of data centers, electric vehicle (EV) charging networks, and renewable energy installations has further driven the demand for cutting-edge protection systems that safeguard electrical equipment from unpredictable power surges.
The expanding adoption of automation and smart technologies across industries has also contributed to market expansion. Industrial and commercial sectors are increasingly integrating surge protection devices to enhance operational efficiency and reduce downtime caused by electrical disturbances. Additionally, the surge in electricity consumption, driven by urbanization and the digital economy, has created a higher demand for robust power protection solutions. The integration of polymer surge arresters in smart grids, high-voltage transmission systems, and substations ensures better electrical network reliability. Governments and private enterprises worldwide are investing in modernizing power infrastructure, further boosting the adoption of polymer-based surge protection devices.
| Market Scope | |
|---|---|
| Start Year | 2024 |
| Forecast Year | 2025-2034 |
| Start Value | $904.8 Million |
| Forecast Value | $1.5 Billion |
| CAGR | 5.4% |
The medium voltage segment is projected to generate USD 640 million by 2034, driven by rapid advancements in industrial automation, smart grid expansion, and the widespread deployment of renewable energy sources. With industries relying on more interconnected and complex electrical networks, the necessity for premium surge arresters is growing. The shift toward sustainable energy systems and digitalized industrial operations has intensified the focus on safeguarding power grids from voltage fluctuations and electrical disruptions.
The utility sector, holding a dominant 36.4% market share in 2024, is set to expand at a CAGR of 4.5% through 2034. The ongoing transition toward renewable energy and power grid modernization initiatives is accelerating the demand for reliable surge protection in utility networks. Moreover, as residential and commercial buildings incorporate increasingly sophisticated electronic systems, the need for high-performance surge arresters to prevent damage from voltage spikes has surged.
Europe polymer surge arrester market is poised to reach USD 380 million by 2034, with strong demand across smart grids, industrial automation, and renewable energy applications. The region's commitment to sustainability, backed by aggressive renewable energy targets, has fueled investments in advanced surge protection solutions. With solar and wind energy capacities rising, the necessity for dependable surge arresters in renewable energy installations is growing. Germany, leading the way in industrial automation and clean energy integration, remains the largest market in the region.
Table of Contents
Chapter 1 Methodology & Scope
- 1.1 Market definitions
- 1.2 Base estimates & calculations
- 1.3 Forecast calculation
- 1.4 Data sources
- 1.4.1 Primary
- 1.4.2 Secondary
- 1.4.2.1 Paid
- 1.4.2.2 Public
Chapter 2 Executive Summary
- 2.1 Industry synopsis, 2021 - 2034
Chapter 3 Industry Insights
- 3.1 Industry ecosystem analysis
- 3.2 Regulatory landscape
- 3.3 Industry impact forces
- 3.3.1 Growth drivers
- 3.3.2 Industry pitfalls & challenges
- 3.4 Growth potential analysis
- 3.5 Porter's analysis
- 3.5.1 Bargaining power of suppliers
- 3.5.2 Bargaining power of buyers
- 3.5.3 Threat of new entrants
- 3.5.4 Threat of substitutes
- 3.6 PESTEL analysis
Chapter 4 Competitive Landscape, 2024
- 4.1 Strategic dashboard
- 4.2 Innovation & sustainability landscape
Chapter 5 Market Size and Forecast, By Voltage, 2021 – 2034 (USD Million, ‘000 Units)
- 5.1 Key trends
- 5.2 Low
- 5.3 Medium
- 5.4 High
Chapter 6 Market Size and Forecast, By Class, 2021 – 2034 (USD Million, ‘000 Units)
- 6.1 Key trends
- 6.2 Distribution
- 6.3 Intermediate
- 6.4 Station
Chapter 7 Market Size and Forecast, By Application, 2021 – 2034 (USD Million, ‘000 Units)
- 7.1 Key trends
- 7.2 Residential & commercial
- 7.3 Industrial
- 7.4 Utility
Chapter 8 Market Size and Forecast, By Region, 2021 – 2034 (USD Million, ‘000 Units)
- 8.1 Key trends
- 8.2 North America
- 8.2.1 U.S.
- 8.2.2 Canada
- 8.2.3 Mexico
- 8.3 Europe
- 8.3.1 UK
- 8.3.2 Germany
- 8.3.3 France
- 8.3.4 Italy
- 8.3.5 Spain
- 8.4 Asia Pacific
- 8.4.1 China
- 8.4.2 Japan
- 8.4.3 India
- 8.4.4 South Korea
- 8.4.5 Australia
- 8.5 Middle East & Africa
- 8.5.1 Saudi Arabia
- 8.5.2 UAE
- 8.5.3 Qatar
- 8.5.4 South Africa
- 8.6 Latin America
- 8.6.1 Brazil
- 8.6.2 Argentina
Chapter 9 Company Profiles
- 9.1 ABB
- 9.2 CG Power & Industrial Solutions
- 9.3 CHINT Group
- 9.4 Compaq International
- 9.5 DEHN SE
- 9.6 Eaton
- 9.7 Electric Powertek
- 9.8 Elpro
- 9.9 Ensto
- 9.10 General Electric
- 9.11 Hangzhou Yongde Electric Appliances
- 9.12 Hubbell
- 9.13 INAEL
- 9.14 Izoelektro
- 9.15 Rashtriya Electrical and Engineering Corporation
- 9.16 Siemens Energy
- 9.17 Surgetek
- 9.18 TE Connectivity
- 9.19 Toshiba Energy Systems & Solutions
- 9.20 Zhejiang Ruili Electric
- 9.21 Zhejiang Volcano Electrical Technology

