
PUBLISHER: Global Market Insights Inc. | PRODUCT CODE: 1667171

PUBLISHER: Global Market Insights Inc. | PRODUCT CODE: 1667171
On-Board Connectivity Market Opportunity, Growth Drivers, Industry Trend Analysis, and Forecast 2025 - 2034
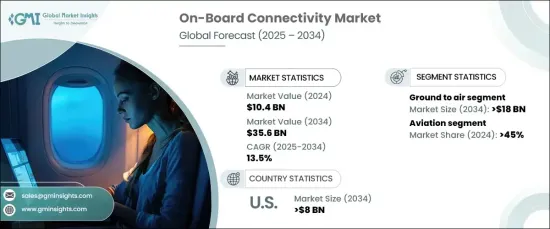
The Global On-Board Connectivity Market was valued at USD 10.4 billion in 2024 and is projected to grow at a robust CAGR of 13.5% from 2025 to 2034. The increasing integration of onboard Wi-Fi into transportation services is a key driver of this growth, transforming passenger experiences with seamless internet access, entertainment options, and connectivity during travel. This innovation aligns with the rising expectations of modern travelers, who demand uninterrupted digital engagement.
The development of smart transportation systems further accelerates market expansion. Onboard connectivity enables advanced features such as real-time navigation, traffic updates, and autonomous vehicle functionalities, playing a critical role in intelligent transportation networks. These cutting-edge technologies enhance efficiency, boost safety, and deliver a superior user experience, fueling the demand for reliable and high-performance connectivity solutions.
| Market Scope | |
|---|---|
| Start Year | 2024 |
| Forecast Year | 2025-2034 |
| Start Value | $10.4 Billion |
| Forecast Value | $35.6 Billion |
| CAGR | 13.5% |
The market is segmented into ground-to-air and satellite connectivity technologies. In 2024, ground-to-air technology accounted for 50% of the market share and is expected to generate USD 18 billion by 2034. This growth is driven by its application in real-time monitoring of vehicle systems, especially within the aviation sector. Ground-to-air technology supports remote tracking and analysis of vital parameters, enabling timely maintenance and minimizing downtime. These advancements significantly enhance operational reliability, optimize safety, and reduce costs, offering substantial benefits to transportation providers.
The market is further divided into end-user segments, including maritime, railway, and aviation sectors. The aviation segment maintains a dominant market position, driven by the evolution of in-flight entertainment systems that cater to passenger demands for personalized, on-demand content. These systems not only enhance the overall travel experience but also serve as a major growth driver for the aviation sector, helping airlines differentiate themselves in a competitive market.
The U.S. on-board connectivity market held an impressive 75% share in 2024, a testament to the nation's advanced technological infrastructure and widespread adoption of high-speed internet. The country's significant investments in satellite communication systems, combined with the presence of leading connectivity solution providers, further bolster market growth. This environment fosters continuous innovation, ensuring the U.S. remains a global leader in onboard connectivity advancements.
Table of Contents
Chapter 1 Methodology & Scope
- 1.1 Research design
- 1.1.1 Research approach
- 1.1.2 Data collection methods
- 1.2 Base estimates and calculations
- 1.2.1 Base year calculation
- 1.2.2 Key trends for market estimates
- 1.3 Forecast model
- 1.4 Primary research & validation
- 1.4.1 Primary sources
- 1.4.2 Data mining sources
- 1.5 Market definitions
Chapter 2 Executive Summary
- 2.1 Industry 3600 synopsis, 2021 - 2034
Chapter 3 Industry Insights
- 3.1 Industry ecosystem analysis
- 3.2 Supplier landscape
- 3.2.1 Software Providers
- 3.2.2 Service Providers
- 3.2.3 Distributors
- 3.2.4 End use
- 3.3 Profit margin analysis
- 3.4 Pricing analysis of
- 3.5 Cost Breakdown
- 3.6 Technology & innovation landscape
- 3.7 Key news & initiatives
- 3.8 Regulatory landscape
- 3.9 Impact forces
- 3.9.1 Growth drivers
- 3.9.1.1 Rising demand for seamless connectivity on board
- 3.9.1.2 Rising advancements in smart transportation systems
- 3.9.1.3 The proliferation of in-flight entertainment
- 3.9.1.4 Advancements in satellite communication
- 3.9.2 Industry pitfalls & challenges
- 3.9.2.1 High implementation and maintenance costs
- 3.9.2.2 Security concerns associated with on-board connectivity
- 3.9.1 Growth drivers
- 3.10 Growth potential analysis
- 3.11 Porter’s analysis
- 3.12 PESTEL analysis
Chapter 4 Competitive Landscape, 2024
- 4.1 Introduction
- 4.2 Company market share analysis
- 4.3 Competitive positioning matrix
- 4.4 Strategic outlook matrix
Chapter 5 Market Estimates & Forecast, By Component, 2021 - 2034 ($Bn)
- 5.1 Key trends
- 5.2 Software
- 5.3 Services
Chapter 6 Market Estimates & Forecast, By Technology, 2021 - 2034 ($Bn)
- 6.1 Key trends
- 6.2 Ground to air
- 6.3 Satellite
Chapter 7 Market Estimates & Forecast, By Application, 2021 - 2032 ($Bn)
- 7.1 Key trends
- 7.2 Communication
- 7.3 Monitoring
- 7.4 Entertainment
Chapter 8 Market Estimates & Forecast, By End Use, 2021 - 2032 ($Bn)
- 8.1 Key trends
- 8.2 Maritime
- 8.3 Railway
- 8.4 Aviation
Chapter 9 Market Estimates & Forecast, By Region, 2021 - 2034 ($Bn)
- 9.1 Key trends
- 9.2 North America
- 9.2.1 U.S.
- 9.2.2 Canada
- 9.3 Europe
- 9.3.1 UK
- 9.3.2 Germany
- 9.3.3 France
- 9.3.4 Spain
- 9.3.5 Italy
- 9.3.6 Russia
- 9.3.7 Nordics
- 9.4 Asia Pacific
- 9.4.1 China
- 9.4.2 India
- 9.4.3 Japan
- 9.4.4 South Korea
- 9.4.5 ANZ
- 9.4.6 Southeast Asia
- 9.5 Latin America
- 9.5.1 Brazil
- 9.5.2 Mexico
- 9.5.3 Argentina
- 9.6 MEA
- 9.6.1 UAE
- 9.6.2 South Africa
- 9.6.3 Saudi Arabia
Chapter 10 Company Profiles
- 10.1 AT&T
- 10.2 Bombardier
- 10.3 Collins Aerospace
- 10.4 Global Eagle Entertainment
- 10.5 Gogo
- 10.6 Huawei Technologies
- 10.7 Honeywell International
- 10.8 Intelsat US LLC
- 10.9 Inmarsat
- 10.10 Nokia
- 10.11 Nomad Digital
- 10.12 Panasonic
- 10.13 Qualcomm
- 10.14 Teleste
- 10.15 Thales Group
- 10.16 Viasat
- 10.17 ZTE

