
PUBLISHER: Global Market Insights Inc. | PRODUCT CODE: 1755361

PUBLISHER: Global Market Insights Inc. | PRODUCT CODE: 1755361
Power Generation Carbon Capture and Storage Market Opportunity, Growth Drivers, Industry Trend Analysis, and Forecast 2025 - 2034
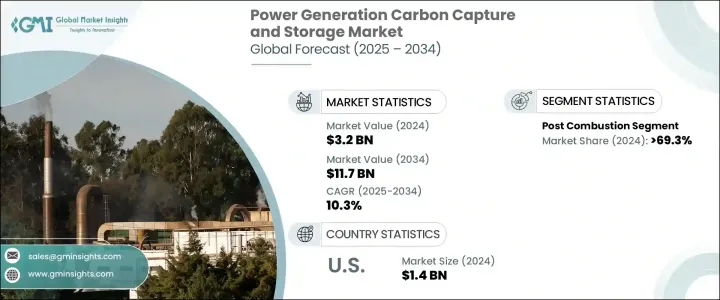
The Global Power Generation Carbon Capture and Storage Market was valued at USD 3.2 billion in 2024 and is estimated to grow at a CAGR of 10.3% to reach USD 11.7 billion by 2034, driven by the increasing implementation of stringent environmental regulations that mandate the reduction of greenhouse gas emissions from power plants. Governments worldwide enforce heavy penalties for high carbon emissions, pushing the adoption of CCS technologies to help companies meet their environmental goals. As nations ramp up their commitments to achieving net-zero emissions, CCS has become an essential tool in the transition towards cleaner energy sources, providing a way for power plants to continue producing energy while reducing their carbon footprint.
CCS technologies enable power companies to lower their emissions while maintaining energy production, making them attractive to environmentally conscious investors and consumers. This trend aligns with global climate agreements and demonstrates a commitment to sustainability. The combination of CCS with renewable energy allows for stable power generation without compromising environmental impact. Pre-combustion CCS, for example, is expected to see significant growth, offering an innovative method for reducing emissions before fossil fuels are burned.
| Market Scope | |
|---|---|
| Start Year | 2024 |
| Forecast Year | 2025-2034 |
| Start Value | $3.2 Billion |
| Forecast Value | $11.7 Billion |
| CAGR | 10.3% |
The pre-combustion segment in the power generation carbon capture and storage market is projected to grow at a CAGR of 6% by 2034. This technology enables the conversion of fossil fuels into a hydrogen-rich gas that can be used in power generation or other industrial processes. The United States has been actively involved in adopting CCS, with the government offering incentives for the development of storage facilities and technologies aimed at reducing carbon emissions.
United States Power Generation Carbon Capture and Storage Market generated USD 1.4 billion in 2024 and is benefiting significantly from a combination of government incentives and growing efforts to reduce emissions from coal and gas power plants. The government has introduced several initiatives and financial support mechanisms to encourage the adoption of cleaner technologies, including carbon capture and storage (CCS) solutions. These incentives not only make CCS more financially viable for power companies but also align with the broader goals of reducing greenhouse gas emissions to combat climate change. As a result, utilities in the U.S. are investing heavily in CCS technology to modernize their infrastructure and meet stricter environmental standards.
Key players in the Global Power Generation Carbon Capture and Storage Market include Aker Solutions, Equinor ASA, Exxon Mobil Corporation, Fluor Corporation, General Electric, Mitsubishi Heavy Industries Ltd., NRG Energy, Inc., Shell CANSOLV, Siemens, and Linde plc, among others. To strengthen their position in the power generation carbon capture and storage market, companies are investing heavily in innovative CCS technologies, focusing on improving efficiency and reducing the cost of carbon capture. Strategic collaborations with government entities and energy companies are becoming more common to secure funding for large-scale CCS projects. Several companies are also developing and deploying pre-combustion and post-combustion capture systems, which can be integrated into existing power plants, offering a scalable solution for reducing emissions.
Table of Contents
Chapter 1 Methodology & Scope
- 1.1 Market definition
- 1.2 Base estimates & calculations
- 1.3 Forecast calculation
- 1.4 Data source
- 1.4.1 Primary
- 1.4.2 Secondary
- 1.4.2.1 Paid
- 1.4.2.2 Public
Chapter 2 Executive Summary
- 2.1 Industry synopsis, 2021 - 2034
Chapter 3 Industry Insights
- 3.1 Industry ecosystem analysis
- 3.2 Trump administration tariffs analysis
- 3.2.1 Impact on trade
- 3.2.1.1 Trade volume disruptions
- 3.2.1.2 Retaliatory measures
- 3.2.2 Impact on the industry
- 3.2.2.1 Supply-side impact (raw materials)
- 3.2.2.1.1 Price volatility in key materials
- 3.2.2.1.2 Supply chain restructuring
- 3.2.2.1.3 Production cost implications
- 3.2.2.2 Demand-side impact (selling price)
- 3.2.2.2.1 Price transmission to end markets
- 3.2.2.2.2 Market share dynamics
- 3.2.2.2.3 Consumer response patterns
- 3.2.2.1 Supply-side impact (raw materials)
- 3.2.3 Key companies impacted
- 3.2.4 Strategic industry responses
- 3.2.4.1 Supply chain reconfiguration
- 3.2.4.2 Pricing and product strategies
- 3.2.4.3 Policy engagement
- 3.2.1 Impact on trade
- 3.3 Outlook and future considerations
- 3.4 Industry impact forces
- 3.4.1 Growth drivers
- 3.4.2 Industry pitfalls & challenges
- 3.5 Growth potential analysis
- 3.6 Porter's analysis
- 3.6.1 Bargaining power of suppliers
- 3.6.2 Bargaining power of buyers
- 3.6.3 Threat of new entrants
- 3.6.4 Threat of substitutes
- 3.7 PESTEL analysis
Chapter 4 Competitive landscape, 2024
- 4.1 Introduction
- 4.2 Company market share
- 4.3 Strategic dashboard
- 4.4 Strategic initiative
- 4.5 Competitive benchmarking
- 4.6 Innovation & sustainability landscape
Chapter 5 Market Size and Forecast, By Technology, 2021 - 2034 (MTPA, USD Billion)
- 5.1 Key trends
- 5.2 Pre-combustion
- 5.3 Post combustion
- 5.4 Oxy-fuel combustion
Chapter 6 Market Size and Forecast, By Region, 2021 - 2034 (MTPA, USD Billion)
- 6.1 Key trends
- 6.2 North America
- 6.2.1 U.S.
- 6.2.2 Canada
- 6.3 Europe
- 6.3.1 Norway
- 6.3.2 Netherlands
- 6.3.3 UK
- 6.4 Asia Pacific
- 6.4.1 China
- 6.4.2 South Korea
- 6.4.3 Australia
- 6.5 Rest of the World
Chapter 7 Company Profiles
- 7.1 Air Liquide
- 7.2 Linde plc
- 7.3 Global Thermostat
- 7.4 General Electric
- 7.5 Siemens
- 7.6 Aker Solutions
- 7.7 HALLIBURTON
- 7.8 SLB
- 7.9 Exxon Mobil Corporation
- 7.10 Shell CANSOLV
- 7.11 Mitsubishi Heavy Industries Ltd.
- 7.12 Dakota Gasification Company
- 7.13 NRG Energy, Inc.
- 7.14 Fluor Corporation
- 7.15 Sulzer Ltd
- 7.16 Equinor ASA

