
PUBLISHER: Global Market Insights Inc. | PRODUCT CODE: 1750306

PUBLISHER: Global Market Insights Inc. | PRODUCT CODE: 1750306
Advanced Optics Material Market Opportunity, Growth Drivers, Industry Trend Analysis, and Forecast 2025 - 2034
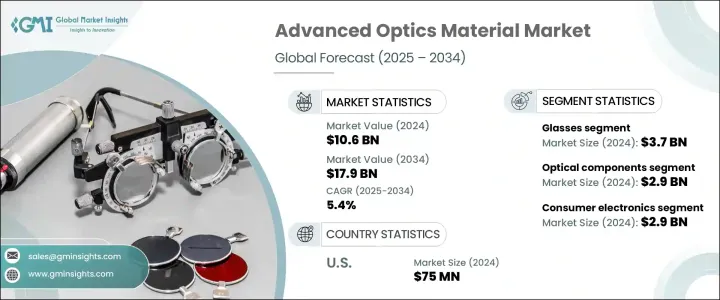
The Global Advanced Optics Material Market was valued at USD 10.6 billion in 2024 and is estimated to grow at a CAGR of 5.4% to reach USD 17.9 billion by 2034, driven by the increasing demand for precise, high-performance optical components across multiple industries. Rapid adoption of AR, VR, LiDAR, and digital technologies elevates the importance of advanced optics in automotive systems, smart consumer electronics, and defense applications. Similarly, the growing reliance on minimally invasive diagnostics and real-time health monitoring is boosting the adoption of precision optics in the healthcare sector.
Advancements in manufacturing, particularly through AI-driven additive and laser-assisted processes, are making custom optical parts more feasible and scalable. These technologies are reducing production time, minimizing waste, and enabling the precision required for intricate optical geometries, which is especially valuable in fields like aerospace, defense, and biomedical imaging. In parallel, ongoing research in nanostructured and meta-optical materials drives the evolution of more compact, lightweight, and efficient optical solutions across diverse applications. These next-generation materials offer unprecedented control over light behavior, such as bending, filtering, or focusing at nanoscale levels, paving the way for revolutionary developments in augmented reality, quantum computing, and photonic chips. Together, these innovations are setting new performance benchmarks and expanding the frontier of advanced optics.
| Market Scope | |
|---|---|
| Start Year | 2024 |
| Forecast Year | 2025-2034 |
| Start Value | $10.6 Billion |
| Forecast Value | $17.9 Billion |
| CAGR | 5.4% |
In terms of material, glass held 35.3% market share in 2024 with a valuation of USD 3.7 billion. Glass is favored for its superior clarity and heat stability in high-performance lenses and precision optics. However, polymer-based alternatives gain ground in consumer electronics and medical instruments due to their cost-effectiveness and lightweight properties. Newer polymer compositions with enhanced UV resistance and refractive performance expand their utility. Additionally, specialty materials such as sapphire and lithium niobate are gaining prominence in high-frequency and laser-based systems due to their thermal durability and birefringence characteristics.
The consumer electronics segment accounted for USD 2.9 billion in 2024, with a projected CAGR of 5.9% through 2034. Advancements in smart glasses, foldable displays, and compact, high-resolution cameras fuel demand for multifunctional and space-efficient optical materials. The healthcare sector integrates optics into diagnostic tools, surgical devices, and biocompatible instruments, enhancing precision and patient safety. In defense and industrial security, rugged optics that can withstand extreme temperatures and deliver high-resolution surveillance and targeting are seeing rising demand.
United States Advanced Optics Material Market reached USD 75 million and is expected to grow at a 6.9% CAGR, underpinned by a concentration of aerospace, defense, and tech development activities across the region. Substantial government and private investment in photonics, integrated optics, and quantum technologies is further propelling the use of novel materials like silicon nitride and lithium niobate in next-gen communication and sensing applications.
Leading companies in this industry include Hoya Corporation, Edmund Optics, CoorsTek, Heraeus Holding, and Corning Incorporated. These players focus on expanding R&D investments, forming cross-industry collaborations, and strengthening their manufacturing capabilities. By innovating in material science and aligning with emerging tech trends, these companies aim to maintain their global leadership and meet evolving customer needs in traditional and disruptive application areas.
Table of Contents
Chapter 1 Methodology & Scope
- 1.1 Market scope & definitions
- 1.2 Base estimates & calculations
- 1.3 Forecast calculations
- 1.4 Data sources
- 1.4.1 Primary
- 1.4.2 Secondary
- 1.4.2.1 Paid sources
- 1.4.2.2 Public sources
Chapter 2 Executive Summary
- 2.1 Industry synopsis, 2021-2034
Chapter 3 Industry Insights
- 3.1 Industry ecosystem analysis
- 3.1.1 Factor affecting the value chain
- 3.1.2 Profit margin analysis
- 3.1.3 Disruptions
- 3.1.4 Future outlook
- 3.1.5 Manufacturers
- 3.1.6 Distributors
- 3.2 Trump administration tariffs
- 3.2.1 Impact on trade
- 3.2.1.1 Trade volume disruptions
- 3.2.1.2 Retaliatory measures
- 3.2.2 Impact on the industry
- 3.2.2.1 Supply-side impact (raw materials)
- 3.2.2.1.1 Price volatility in key materials
- 3.2.2.1.2 Supply chain structure
- 3.2.2.1.3 Production cost implications
- 3.2.2.1 Supply-side impact (raw materials)
- 3.2.3 Demand-side impact (selling price)
- 3.2.3.1 Price transmission to end markets
- 3.2.3.2 Market share dynamics
- 3.2.3.3 Consumer response patterns
- 3.2.4 Key companies impacted
- 3.2.5 Strategic industry responses
- 3.2.5.1 Supply chain reconfiguration
- 3.2.5.2 Pricing and product strategies
- 3.2.5.3 Policy engagement
- 3.2.6 Outlook and future considerations
- 3.2.1 Impact on trade
- 3.3 Trade statistics (HS code) Note: the above trade statistics will be provided for key countries only.
- 3.3.1 Major exporting countries, 2021-2024 (kilo tons)
- 3.3.2 Major importing countries, 2021-2024 (kilo tons)
- 3.4 Supplier landscape
- 3.5 Profit margin analysis
- 3.6 Key news & initiatives
- 3.7 Regulatory landscape
- 3.8 Impact forces
- 3.8.1 Growth drivers
- 3.8.1.1 Growing demand for high-performance optical components
- 3.8.1.2 Advancements in photonics and quantum optics
- 3.8.1.3 Increasing applications in telecommunication
- 3.8.1.4 Rising adoption in healthcare and medical devices
- 3.8.2 Industry pitfalls & challenges
- 3.8.2.1 High production costs
- 3.8.2.2 Raw material supply
- 3.8.2.3 Regulatory challenges
- 3.8.1 Growth drivers
- 3.9 Market opportunities
- 3.9.1 Emerging applications in augmented and virtual reality
- 3.9.2 Growing demand for advanced sensing technologies
- 3.9.3 Expansion in autonomous vehicle systems
- 3.9.4 Development of biomimetic optical materials
- 3.10 Growth potential analysis
- 3.11 Regulatory framework analysis
- 3.11.1 Reach and ROHS regulations
- 3.11.2 Export control regulations
- 3.11.3 Environmental compliance requirements
- 3.11.4 Safety standards for handling and processing
- 3.12 Technology landscape
- 3.12.1 Current technological trends
- 3.12.2 Emerging technologies
- 3.12.3 R&D initiatives and innovation pipeline
- 3.12.4 Patent analysis
- 3.13 Porter's analysis
- 3.14 PESTEL analysis
Chapter 4 Competitive Landscape, 2024
- 4.1 Introduction
- 4.2 Market share analysis
- 4.2.1 Global market share by manufacturer
- 4.2.2 Regional market share by manufacturer
- 4.3 Competitive benchmarking
- 4.3.1 Product portfolio comparison
- 4.3.2 Technological capabilities comparison
- 4.3.3 R&D investment comparison
- 4.3.4 Manufacturing capacity comparison
- 4.4 Strategic initiatives & developments
- 4.4.1 Mergers & acquisitions
- 4.4.2 Partnerships & collaborations
- 4.4.3 Product launches & innovations
- 4.4.4 Expansion plans
- 4.5 Competitive positioning matrix
- 4.6 Strategic dashboard
Chapter 5 Market Estimates & Forecast, By Material Type, 2021-2034 (USD Billion) (Kilo Tons)
- 5.1 Key trends
- 5.2 Glass materials
- 5.2.1 Optical glass
- 5.2.2 Fused silica
- 5.2.3 Borosilicate glass
- 5.2.4 Specialty glass
- 5.2.5 Others
- 5.3 Polymeric materials
- 5.3.1 Polymethyl methacrylate (PMMA)
- 5.3.2 Polycarbonate (PC)
- 5.3.3 Cyclic olefin polymer (COP)
- 5.3.4 Cyclic olefin copolymer (COC)
- 5.3.5 Others
- 5.4 Crystalline materials
- 5.4.1 Sapphire
- 5.4.2 Silicon
- 5.4.3 Germanium
- 5.4.4 Zinc selenide
- 5.4.5 Calcium fluoride
- 5.4.6 Others
- 5.5 Ceramic materials
- 5.5.1 Transparent ceramics
- 5.5.2 Aluminum oxynitride (ALON)
- 5.5.3 Magnesium aluminate spinel
- 5.5.4 Yttrium aluminum garnet (YAG)
- 5.5.5 Others
- 5.6 Metallic materials
- 5.6.1 Aluminum
- 5.6.2 Silver
- 5.6.3 Gold
- 5.6.4 Others
- 5.7 Advanced composite materials
- 5.8 Photonic crystals
- 5.9 Metamaterials
- 5.10 Nanomaterials
- 5.11 Others
Chapter 6 Market Estimates & Forecast, By Application, 2021-2034 (USD Billion) (Kilo Tons)
- 6.1 Key trends
- 6.2 Optical components
- 6.2.1 Lenses
- 6.2.2 Mirrors
- 6.2.3 Prisms
- 6.2.4 Windows
- 6.2.5 Filters
- 6.2.6 Diffraction gratings
- 6.2.7 Others
- 6.3 Optoelectronic devices
- 6.3.1 Light emitting diodes (LEDs)
- 6.3.2 Laser diodes
- 6.3.3 Photodetectors
- 6.3.4 Solar cells
- 6.3.5 Optical modulators
- 6.3.6 Others
- 6.4 Imaging systems
- 6.4.1 Cameras
- 6.4.2 Microscopes
- 6.4.3 Telescopes
- 6.4.4 Thermal imaging
- 6.4.5 Others
- 6.5 Optical communication
- 6.5.1 Optical fibers
- 6.5.2 Waveguides
- 6.5.3 Optical amplifiers
- 6.5.4 Optical switches
- 6.5.5 Others
- 6.6 Sensing and measurement
- 6.6.1 Optical sensors
- 6.6.2 Spectroscopy
- 6.6.3 Interferometry
- 6.6.4 Others
- 6.7 Display technologies
- 6.7.1 LCD displays
- 6.7.2 OLED displays
- 6.7.3 AR/VR displays
- 6.7.4 Others
- 6.8 Others
Chapter 7 Market Estimates & Forecast, By End Use Industry, 2021-2034 (USD Billion) (Kilo Tons)
- 7.1 Key trends
- 7.2 Consumer electronics
- 7.2.1 Smartphones
- 7.2.2 Cameras
- 7.2.3 Wearable devices
- 7.2.4 Others
- 7.3 Healthcare and medical
- 7.3.1 Diagnostic equipment
- 7.3.2 Surgical devices
- 7.3.3 Therapeutic systems
- 7.3.4 Medical imaging
- 7.3.5 Others
- 7.4 Defense and security
- 7.4.1 Night vision
- 7.4.2 Targeting systems
- 7.4.3 Surveillance
- 7.4.4 Others
- 7.5 Telecommunications
- 7.5.1 Optical networks
- 7.5.2 Data centers
- 7.5.3 5g infrastructure
- 7.5.4 Others
- 7.6 Automotive
- 7.6.1 Lighting systems
- 7.6.2 Heads-up displays
- 7.6.3 Lidar systems
- 7.6.4 Driver assistance systems
- 7.6.5 Others
- 7.7 Aerospace
- 7.7.1 Avionics
- 7.7.2 Navigation systems
- 7.7.3 Satellite components
- 7.7.4 Others
- 7.8 Industrial
- 7.8.1 Machine vision
- 7.8.2 Laser processing
- 7.8.3 Quality control
- 7.8.4 Others
- 7.9 Energy
- 7.9.1 Solar energy
- 7.9.2 Photovoltaics
- 7.9.3 Others
- 7.10 Research and development
- 7.11 Others
Chapter 8 Market Estimates & Forecast, By Region, 2021-2034 (USD Billion) (Kilo Tons)
- 8.1 Key trends
- 8.2 North America
- 8.2.1 U.S.
- 8.2.2 Canada
- 8.3 Europe
- 8.3.1 UK
- 8.3.2 Germany
- 8.3.3 France
- 8.3.4 Italy
- 8.3.5 Spain
- 8.3.6 Rest of Europe
- 8.4 Asia Pacific
- 8.4.1 China
- 8.4.2 India
- 8.4.3 Japan
- 8.4.4 South Korea
- 8.4.5 Australia
- 8.4.6 Rest of Asia Pacific
- 8.5 Latin America
- 8.5.1 Brazil
- 8.5.2 Mexico
- 8.5.3 Argentina
- 8.5.4 Rest of Latin America
- 8.6 MEA
- 8.6.1 South Africa
- 8.6.2 Saudi Arabia
- 8.6.3 UAE
- 8.6.4 Rest of Middle East and Africa
Chapter 9 Company Profiles
- 9.1 CoorsTek
- 9.2 Corning Incorporated
- 9.3 Edmund Optics
- 9.4 Heraeus Holding
- 9.5 Hoya Corporation
- 9.6 II-VI Incorporated
- 9.7 Materion Corporation
- 9.8 Newport Corporation
- 9.9 Nikon Corporation
- 9.10 Ohara Corporation
- 9.11 SCHOTT
- 9.12 Sumitomo Electric Industries
- 9.13 Surmet Corporation
- 9.14 Thorlabs
- 9.15 ZEISS Group

