
PUBLISHER: Global Market Insights Inc. | PRODUCT CODE: 1750585

PUBLISHER: Global Market Insights Inc. | PRODUCT CODE: 1750585
Wet Flue Gas Desulfurization System Market Opportunity, Growth Drivers, Industry Trend Analysis, and Forecast 2025 - 2034
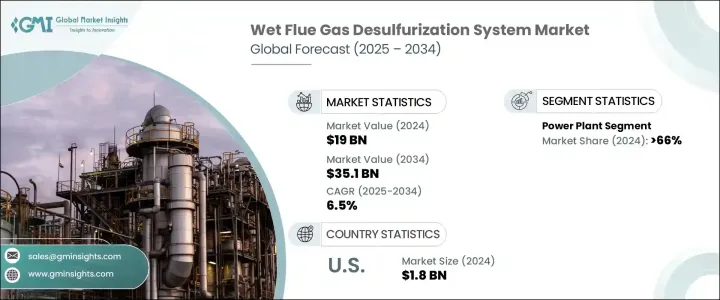
The Global Wet Flue Gas Desulfurization System Market was valued at USD 19 billion in 2024 and is estimated to grow at a CAGR of 6.5% to reach USD 35.1 billion by 2034 driven by the increasing global emphasis on cleaner energy sources and stricter environmental regulations aimed at reducing sulfur dioxide (SO?) emissions from industrial processes, particularly in power generation. Adopting WFGD systems is essential for industries to comply with these regulations and mitigate their environmental impact.
Technological advancements have significantly improved the efficiency and cost-effectiveness of WFGD systems. Innovations in absorbent materials and system designs have enhanced SO? removal capabilities, making these systems more accessible to industries. The ability to customize WFGD systems to meet specific emission standards further contributes to their widespread adoption. The ability to customize WFGD systems to meet specific emission standards further contributes to their widespread adoption. Industries are increasingly favoring solutions tailored to align with regional regulatory frameworks, making WFGD systems a flexible choice for emission control. This adaptability ensures compliance with current and future environmental policies, essential as governments continue tightening pollution standards. Additionally, the production of by-products like synthetic gypsum, which can be utilized in construction materials, adds economic value to these systems. Instead of treating sulfur dioxide capture as waste, industries can now convert it into a revenue-generating material used in drywall, cement, and agricultural products.
| Market Scope | |
|---|---|
| Start Year | 2024 |
| Forecast Year | 2025-2034 |
| Start Value | $19 Billion |
| Forecast Value | $35.1 Billion |
| CAGR | 6.5% |
The power generation sector remains the largest application segment, accounting for 66% share in 2024, attributed to the high SO? emissions associated with coal-fired power plants and the stringent regulations governing these emissions. The Asia Pacific region, particularly China and India, is experiencing rapid industrialization, increasing pollution levels, and a heightened demand for effective emission control technologies.
United States Wet Flue Gas Desulfurization System Market was valued at USD 1.8 billion in 2024, fueled by stringent regulatory measures, such as the Mercury and Air Toxics Standards (MATS) and the Cross-State Air Pollution Rule (CSAPR), which limit SO? emissions from power plants. Compliance with these regulations necessitates the implementation of advanced emission control technologies, including WFGD systems.
Key players in the Wet Flue Gas Desulfurization System Market include CECO Environmental, KC Cottrell India, Hitachi Zosen Inova AG, Marsulex Environmental Technologies, Verantis Environmental Solutions Group, KCH Services, Inc., Mitsubishi Heavy Industries Ltd., Valmet Corporation, GEA Group Aktiengesellschaft, Babcock & Wilcox Enterprises, Inc., Ducon Infratechnologies Ltd., Nederman Holding AB, General Electric, S.A. HAMON, Tri-Mer Corporation, and Thermax Limited. These companies are focusing on expanding their product offerings and enhancing system efficiencies to meet the evolving demands of the market. Strategic partnerships, technological innovations, and a commitment to sustainability are key strategies employed to strengthen their market presence and competitiveness.
Table of Contents
Chapter 1 Methodology & Scope
- 1.1 Market scope & definitions
- 1.2 Market estimates & forecast parameters
- 1.3 Forecast calculation
- 1.4 Data sources
- 1.4.1 Primary
- 1.4.2 Secondary
- 1.4.2.1 Paid
- 1.4.2.2 Public
Chapter 2 Executive Summary
- 2.1 Industry synopsis, 2021 - 2034
Chapter 3 Industry Insights
- 3.1 Industry ecosystem analysis
- 3.2 Trump administration tariffs analysis
- 3.2.1 Impact on trade
- 3.2.1.1 Trade volume disruptions
- 3.2.1.2 Retaliatory measures
- 3.2.2 Impact on the industry
- 3.2.2.1 Supply-side impact (raw materials)
- 3.2.2.1.1 Price volatility in key materials
- 3.2.2.1.2 Supply chain restructuring
- 3.2.2.1.3 Production cost implications
- 3.2.2.2 Demand-side impact (selling price)
- 3.2.2.2.1 Price transmission to end markets
- 3.2.2.2.2 Market share dynamics
- 3.2.2.2.3 Consumer response patterns
- 3.2.2.1 Supply-side impact (raw materials)
- 3.2.3 Key companies impacted
- 3.2.4 Strategic industry responses
- 3.2.4.1.1 Supply chain reconfiguration
- 3.2.4.1.2 Pricing and product strategies
- 3.2.4.1.3 Policy engagement
- 3.2.5 Outlook and future considerations
- 3.2.1 Impact on trade
- 3.3 Regulatory landscape
- 3.4 Industry impact forces
- 3.4.1 Growth drivers
- 3.4.2 Industry pitfalls & challenges
- 3.5 Growth potential analysis
- 3.6 Porter's analysis
- 3.6.1 Bargaining power of suppliers
- 3.6.2 Bargaining power of buyers
- 3.6.3 Threat of new entrants
- 3.6.4 Threat of substitutes
- 3.7 PESTEL analysis
Chapter 4 Competitive Landscape, 2025
- 4.1 Introduction
- 4.2 Company market share analysis, 2024
- 4.3 Strategic dashboard
- 4.4 Strategic initiative
- 4.5 Competitive benchmarking
- 4.6 Innovation & sustainability landscape
Chapter 5 Market Size and Forecast, By Application, 2021 - 2034 (USD Billion)
- 5.1 Key trends
- 5.2 Power plants
- 5.3 Chemical & petrochemical
- 5.4 Cement
- 5.5 Metal processing & mining
- 5.6 Manufacturing
- 5.7 Others
Chapter 6 Market Size and Forecast, By Region, 2021 - 2034 (USD Billion)
- 6.1 Key trends
- 6.2 North America
- 6.2.1 U.S.
- 6.2.2 Canada
- 6.2.3 Mexico
- 6.3 Europe
- 6.3.1 Germany
- 6.3.2 UK
- 6.3.3 France
- 6.3.4 Spain
- 6.3.5 Italy
- 6.3.6 Netherlands
- 6.4 Asia Pacific
- 6.4.1 China
- 6.4.2 India
- 6.4.3 Japan
- 6.4.4 South Korea
- 6.4.5 Indonesia
- 6.4.6 Australia
- 6.5 Middle East & Africa
- 6.5.1 Saudi Arabia
- 6.5.2 UAE
- 6.5.3 South Africa
- 6.6 Latin America
- 6.6.1 Brazil
- 6.6.2 Chile
- 6.6.3 Argentina
Chapter 7 Company Profiles
- 7.1 Babcock & Wilcox Enterprises, Inc.
- 7.2 CECO Environmental
- 7.3 Ducon Infratechnologies Ltd.
- 7.4 GEA Group Aktiengesellschaft
- 7.5 General Electric
- 7.6 Hitachi Zosen Inova AG
- 7.7 KC Cottrell India
- 7.8 KCH Services, Inc.
- 7.9 Marsulex Environmental Technologies
- 7.10 Mitsubishi Heavy Industries Ltd.
- 7.11 Nederman Holding AB
- 7.12 S.A. HAMON
- 7.13 Thermax Limited.
- 7.14 Tri-Mer Corporation
- 7.15 Valmet
- 7.16 Verantis Environmental Solutions Group

