
PUBLISHER: Global Market Insights Inc. | PRODUCT CODE: 1755205

PUBLISHER: Global Market Insights Inc. | PRODUCT CODE: 1755205
Integrated Visual Augmentation System Market Opportunity, Growth Drivers, Industry Trend Analysis, and Forecast 2025 - 2034
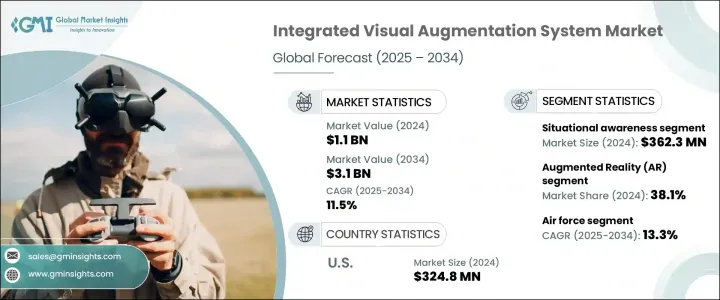
The Global Integrated Visual Augmentation System Market was valued at USD 1.1 billion in 2024 and is estimated to grow at a CAGR of 11.5% to reach USD 3.1 billion by 2034. A major factor influencing this trajectory is the impact of tariffs imposed on Chinese imports, which have driven up procurement costs for critical components like optical sensors and microelectronics. These trade measures have prompted many defense suppliers to revise their sourcing strategies, turning to alternative vendors and increasing domestic manufacturing to manage costs and ensure continued program functionality.
Worldwide, armed forces are ramping up modernization efforts aimed at enhancing soldier performance, agility, and survivability on evolving battlefields. IVAS solutions play a central role in this shift, integrating advanced capabilities such as real-time navigation, communication, thermal imaging, and tactical awareness. Military organizations are adopting these systems to stay ahead of emerging threats, particularly as urban warfare becomes more prevalent and global conflicts intensify. The integration of wearable tech is helping to streamline decision-making and bolster command-and-control processes. Cross-functional defense programs are further driving demand for high-tech, multifunctional devices that meet the increasing complexity of modern combat scenarios.
| Market Scope | |
|---|---|
| Start Year | 2024 |
| Forecast Year | 2025-2034 |
| Start Value | $1.1 Billion |
| Forecast Value | $3.1 Billion |
| CAGR | 11.5% |
In terms of product types, the helmet-mounted display segment generated USD 493.6 million in 2023. These systems are gaining popularity due to their ability to deliver mission-critical data directly within a soldier's field of view, improving reaction time, mobility, and environmental awareness. Demand is on the rise as armed forces aim to optimize real-time tactical execution and situational command.
By technology, Augmented Reality is expected to hold a 38.1% share of the integrated visual augmentation system market in 2024. This technology enhances battlefield functionality by overlaying essential visual data in real-time, significantly improving navigation, threat identification, and operational coordination. Its role as a core enabling technology makes it vital for current and future military strategies focused on immersive, data-rich combat support systems.
United States Integrated Visual Augmentation System Market reached USD 324.8 million in 2024. The country's growth in this sector is being fueled by aggressive investments from both the defense and aerospace sectors. Continued emphasis on system upgrades and federal spending on modern military initiatives are intensifying the need for integrated visual augmentation capabilities, helping to reinforce mission readiness and overall operational efficiency.
Key players influencing the competitive landscape of the Global Integrated Visual Augmentation System Market include Varjo, L3Harris Technologies, Inc., and Elbit Systems Ltd. Leading players in the IVAS market are advancing their competitive edge through a combination of strategic investments, product innovation, and supply chain restructuring. In response to shifting import dynamics, companies have been diversifying vendor bases and boosting domestic component sourcing. Many are prioritizing R&D to enhance AR integration, optical performance, and system durability. These firms are aligning closely with military modernization goals by customizing solutions to meet battlefield-specific needs, including compact designs, seamless communication modules, and real-time data overlays. Forming strategic defense partnerships and participating in government-led technology initiatives are also key tactics being employed to expand market reach and secure long-term contracts.
Table of Contents
Chapter 1 Methodology & Scope
- 1.1 Market scope & definitions
- 1.2 Base estimates & calculations
- 1.3 Forecast calculations
- 1.4 Data sources
- 1.4.1 Primary
- 1.4.2 Secondary
- 1.4.2.1 Paid sources
- 1.4.2.2 Public sources
Chapter 2 Executive Summary
- 2.1 Industry synopsis, 2021-2034
Chapter 3 Industry Insights
- 3.1 Industry ecosystem analysis
- 3.1.1 Factor affecting the value chain
- 3.1.2 Profit margin analysis
- 3.1.3 Disruptions
- 3.1.4 Future outlook
- 3.1.5 Manufacturers
- 3.1.6 Distributors
- 3.2 Trump administration tariff analysis
- 3.2.1 Impact on trade
- 3.2.1.1 Trade volume disruptions
- 3.2.1.2 Retaliatory measures
- 3.2.2 Impact on the industry
- 3.2.2.1 Supply-side impact (raw materials)
- 3.2.2.1.1 Price volatility in key materials
- 3.2.2.1.2 Supply chain restructuring
- 3.2.2.1.3 Production cost implications
- 3.2.2.2 Demand-side impact (selling price)
- 3.2.2.2.1 Price transmission to end markets
- 3.2.2.2.2 Market share dynamics
- 3.2.2.2.3 Consumer response patterns
- 3.2.2.1 Supply-side impact (raw materials)
- 3.2.3 Key companies impacted
- 3.2.4 Strategic industry responses
- 3.2.4.1 Supply chain reconfiguration
- 3.2.4.2 Pricing and product strategies
- 3.2.4.3 Policy engagement
- 3.2.5 Outlook and future considerations
- 3.2.1 Impact on trade
- 3.3 Supplier landscape
- 3.4 Profit margin analysis
- 3.5 Key news & initiatives
- 3.6 Regulatory landscape
- 3.7 Impact forces
- 3.7.1 Growth drivers
- 3.7.1.1 Rising military modernization programs
- 3.7.1.2 Integration of Augmented Reality (AR) and AI
- 3.7.1.3 Demand for enhanced soldier safety and performance
- 3.7.1.4 Supportive government funding and contracts
- 3.7.1.5 Rising global security threats and asymmetric warfare
- 3.7.2 Industry pitfalls & challenges
- 3.7.2.1 High development and procurement costs
- 3.7.2.2 Operational and technical reliability issues
- 3.7.1 Growth drivers
- 3.8 Growth potential analysis
- 3.9 Porter's analysis
- 3.10 PESTEL analysis
Chapter 4 Competitive Landscape, 2024
- 4.1 Introduction
- 4.2 Company market share analysis
- 4.3 Competitive positioning matrix
- 4.4 Strategic outlook matrix
Chapter 5 Market Estimates & Forecast, By Product, 2021-2034 (USD Million & Thousand Unit)
- 5.1 Key trends
- 5.2 Helmet mounted display
- 5.3 Night vision device
Chapter 6 Market Estimates & Forecast, By Technology, 2021-2034 (USD Million & Thousand Unit)
- 6.1 Key trends
- 6.2 Augmented Reality (AR)
- 6.3 Mixed Reality (MR)
- 6.4 Virtual Reality (VR)
- 6.5 Thermal and low-light imaging
- 6.6 Others
Chapter 7 Market Estimates & Forecast, By Application, 2021-2034 (USD Million & Thousand Unit)
- 7.1 Key trends
- 7.2 Situational awareness
- 7.3 Navigation and mapping
- 7.4 Training and simulation
- 7.5 Target acquisition and engagement
- 7.6 Others
Chapter 8 Market Estimates & Forecast, By End Use, 2021-2034 (USD Million & Thousand Unit)
- 8.1 Key trends
- 8.2 Air force
- 8.3 Army
- 8.4 Navy
Chapter 9 Market Estimates & Forecast, By Region, 2021-2034 (USD Million & Thousand Unit)
- 9.1 Key trends
- 9.2 North America
- 9.2.1 U.S.
- 9.2.2 Canada
- 9.3 Europe
- 9.3.1 UK
- 9.3.2 Germany
- 9.3.3 France
- 9.3.4 Italy
- 9.3.5 Spain
- 9.3.6 Russia
- 9.4 Asia Pacific
- 9.4.1 China
- 9.4.2 India
- 9.4.3 Japan
- 9.4.4 South Korea
- 9.4.5 Australia
- 9.5 Latin America
- 9.5.1 Brazil
- 9.5.2 Mexico
- 9.6 MEA
- 9.6.1 South Africa
- 9.6.2 Saudi Arabia
- 9.6.3 UAE
Chapter 10 Company Profiles
- 10.1 Ajnalens
- 10.2 Anduril
- 10.3 Elbit Systems Ltd
- 10.4 L3Harris Technologies, Inc.
- 10.5 Lockheed Martin
- 10.6 Optex Systems
- 10.7 Varjo
- 10.8 VirTra, Inc.
- 10.9 Vrgineers, Inc.
- 10.10 Vuzix Corporation

