
PUBLISHER: Global Market Insights Inc. | PRODUCT CODE: 1766170

PUBLISHER: Global Market Insights Inc. | PRODUCT CODE: 1766170
North America Electric Commercial Vehicle Battery Pack Market Opportunity, Growth Drivers, Industry Trend Analysis, and Forecast 2025 - 2034
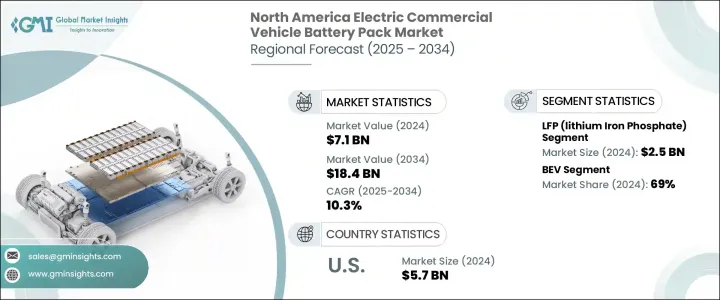
North America Electric Commercial Vehicle Battery Pack Market was valued at USD 7.1 billion in 2024 and is estimated to grow at a CAGR of 10.3% to reach USD 18.4 billion by 2034. This growth is largely attributed to advancements in charging and battery technologies, which are vital to the expansion of electric vehicle fleets. Commercial fleet operators now demand high-capacity, reliable chargers with minimal downtime. The growing adoption of public DC fast chargers, depot charging stations, and megawatt charging systems (MCS) is making commercial electric vehicles (EVs) more feasible and efficient, particularly for regional and long-haul logistics operations. The growing infrastructure development helps eliminate range anxiety, encouraging the use of EVs and fueling the demand for powerful battery packs designed for rapid charging.
Moreover, public and private investment in expanding charging networks further boosts the demand for battery packs and their use in commercial fleets. Government incentives, coupled with emission reduction policies, particularly in the U.S., are accelerating the electrification of fleets. The Inflation Reduction Act (IRA) offers tax credits and subsidies, which significantly reduce the cost of EV purchases and domestic battery manufacturing, creating financial incentives for fleet owners. States like California also impose zero-emission mandates, reinforcing the push for electric commercial vehicles.
| Market Scope | |
|---|---|
| Start Year | 2024 |
| Forecast Year | 2025-2034 |
| Start Value | $7.1 Billion |
| Forecast Value | $18.4 Billion |
| CAGR | 10.3% |
In 2024, the lithium iron phosphate (LFP) battery segment held a market share of 35%, valued at USD 2.5 billion. LFP batteries are preferred for commercial applications due to their high stability and safety, especially in high-temperature conditions. They are less likely to experience thermal runaway or fires, making them a safer option for long-distance freight transport. Although LFP batteries have a lower energy density compared to NMC (Nickel Manganese Cobalt) or NCA (Nickel Cobalt Aluminum) batteries, they meet the range requirements for urban and regional delivery applications. Their lower cost, combined with enhanced safety, makes LFP batteries a favored choice for light and medium-duty commercial electric vehicles (EVs).
The battery electric vehicles (BEVs) segment held a 69% share in 2024. BEVs use a fully electric drivetrain, which is simpler and less prone to mechanical issues than the more complex drivetrains of plug-in hybrids. Commercial fleet operators benefit from BEVs by avoiding fuel costs and reducing maintenance expenses, which contribute to significant total cost of ownership savings. The growth of charging infrastructure-both public and private-supports the increasing adoption of BEVs, especially for logistics, delivery, and transit fleets. Many vehicle manufacturers are focusing heavily on BEV platforms, driven by stronger supply chains and the broader availability of all-electric commercial vehicles. This shift is expected to accelerate the deployment of BEVs in North America's commercial sector.
U.S. Electric Commercial Vehicle Battery Pack Market held an 80% share and generated USD 5.7 billion in 2024. The U.S. has the largest stock of commercial vehicles across sectors like delivery, logistics, construction, and public transit. As a result, demand for electric commercial vehicles and their battery packs is strong. Major players such as Tesla, Ford, GM, Rivian, Proterra, and Lion Electric, along with battery companies like American Battery Solutions and Kore Power, are playing a crucial role in this market. The U.S. government's support for local production of battery packs and its policy incentives for fleet electrification continue to strengthen the adoption of electric commercial vehicles.
Key companies operating in the North America Electric Commercial Vehicle Battery Pack Market include: AESC Group, Accelera, A123 Systems, BYD, CATL, LG Energy Solution, Panasonic, Samsung SDI, SK Innovation, and American Battery Solutions. In the competitive landscape, companies in the North America Electric Commercial Vehicle Battery Pack Market are pursuing strategies to solidify their positions. Many are enhancing their product offerings by developing battery technologies with improved energy density, faster charging capabilities, and lower production costs. Firms are also investing in expanding their manufacturing capacity and increasing their involvement in developing charging infrastructure. This approach not only strengthens their presence in the market but also ensures they can meet the rising demand for electric commercial vehicles. Some players are collaborating with automakers to integrate battery technology into commercial EV platforms, creating more efficient and scalable solutions.
Table of Contents
Chapter 1 Methodology & Scope
- 1.1 Market scope and definition
- 1.2 Research design
- 1.2.1 Research approach
- 1.2.2 Data collection methods
- 1.3 Base estimates and calculations
- 1.3.1 Base year calculation
- 1.3.2 Key trends for market estimation
- 1.4 Primary research and validation
- 1.4.1 Primary sources
- 1.5 Forecast model
- 1.6 Research assumptions and limitations
Chapter 2 Executive Summary
- 2.1 Industry 3600 synopsis
- 2.2 Key market trends
- 2.2.1 Regional
- 2.2.2 Vehicle
- 2.2.3 Propulsion
- 2.2.4 Battery chemistry
- 2.2.5 Battery capacity
- 2.2.6 Battery form factor
- 2.3 TAM Analysis, 2025-2034
- 2.4 CXO perspectives: Strategic imperatives
- 2.4.1 Executive decision points
- 2.4.2 Critical success factors
- 2.5 Future outlook and strategic recommendations
Chapter 3 Industry Insights
- 3.1 Industry ecosystem analysis
- 3.1.1 Supplier Landscape
- 3.1.2 Profit Margin
- 3.1.3 Cost structure
- 3.1.4 Value addition at each stage
- 3.1.5 Factor affecting the value chain
- 3.1.6 Disruptions
- 3.2 Industry impact forces
- 3.2.1 Growth drivers
- 3.2.1.1 Expansion of charging & battery infrastructure
- 3.2.1.2 Declining battery costs
- 3.2.1.3 Government incentives & emission regulations
- 3.2.1.4 Public sector and fleet electrification
- 3.2.2 Industry pitfalls and challenges
- 3.2.2.1 High upfront costs of commercial EVs and battery packs
- 3.2.2.2 Battery supply chain bottlenecks
- 3.2.3 Market opportunities
- 3.2.1 Growth drivers
- 3.3 Growth potential analysis
- 3.4 Regulatory landscape
- 3.4.1 North America
- 3.4.2 Europe
- 3.4.3 Asia Pacific
- 3.4.4 Latin America
- 3.4.5 Middle East & Africa
- 3.5 Porter's analysis
- 3.6 PESTEL analysis
- 3.7 Technology and innovation landscape
- 3.7.1 Current technological trends
- 3.7.2 Emerging technologies
- 3.8 Comparative study of battery chemistry
- 3.9 Price trends
- 3.9.1 By region
- 3.9.2 By product
- 3.10 Production statistics
- 3.10.1 Production hubs
- 3.10.2 Consumption hubs
- 3.10.3 Export and import
- 3.11 Cost breakdown analysis
- 3.12 Patent analysis
- 3.13 Sustainability and environmental aspects
- 3.13.1 Sustainable practices
- 3.13.2 Waste reduction strategies
- 3.13.3 Energy efficiency in production
- 3.13.4 Eco-friendly Initiatives
- 3.13.5 Carbon footprint considerations
Chapter 4 Competitive Landscape, 2024
- 4.1 Introduction
- 4.2 Company market share analysis
- 4.2.1 North America
- 4.2.2 Europe
- 4.2.3 Asia Pacific
- 4.2.4 LATAM
- 4.2.5 MEA
- 4.3 Competitive analysis of major market players
- 4.4 Competitive positioning matrix
- 4.5 Strategic outlook matrix
- 4.6 Key developments
- 4.6.1 Mergers & acquisitions
- 4.6.2 Partnerships & collaborations
- 4.6.3 New product launches
- 4.6.4 Expansion plans and funding
Chapter 5 Market Estimates & Forecast, By Vehicle, 2021 - 2034 ($Bn, Units)
- 5.1 Key trends
- 5.2 Light commercial vehicle (LCV)
- 5.3 Medium commercial vehicle (MCV)
- 5.4 Heavy commercial vehicle (HCV)
Chapter 6 Market Estimates & Forecast, By Propulsion, 2021 - 2034 ($Bn, Units)
- 6.1 Key trends
- 6.2 BEV
- 6.3 PHEV
Chapter 7 Market Estimates & Forecast, By Battery Chemistry, 2021 - 2034 ($Bn, Units)
- 7.1 Key trends
- 7.2 LFP (Lithium Iron Phosphate)
- 7.3 NCA (Nickel Cobalt Aluminum)
- 7.4 NMC (Nickel Manganese Cobalt)
- 7.5 Others
Chapter 8 Market Estimates & Forecast, By Battery Capacity, 2021 - 2034 ($Bn, Units)
- 8.1 Key trends
- 8.2 Below 50 kWh
- 8.3 50-150 kWh
- 8.4 Above 150 kWh
Chapter 9 Market Estimates & Forecast, By Battery Form Factor, 2021 - 2034 ($Bn, Units)
- 9.1 Key trends
- 9.2 Prismatic cells
- 9.3 Pouch cells
- 9.4 Cylindrical cells
Chapter 10 Market Estimates & Forecast, By Region, 2021 - 2034 ($Bn, Units)
- 10.1 Key trends
- 10.2 U.S.
- 10.2.1 Alabama
- 10.2.2 Alaska
- 10.2.3 Arizona
- 10.2.4 Arkansas
- 10.2.5 California
- 10.2.6 Colorado
- 10.2.7 Connecticut
- 10.2.8 Delaware
- 10.2.9 Florida
- 10.2.10 Georgia
- 10.2.11 Hawaii
- 10.2.12 Idaho
- 10.2.13 Illinois
- 10.2.14 Indiana
- 10.2.15 Iowa
- 10.2.16 Kansas
- 10.2.17 Kentucky
- 10.2.18 Louisiana
- 10.2.19 Maine
- 10.2.20 Maryland
- 10.2.21 Massachusetts
- 10.2.22 Michigan
- 10.2.23 Minnesota
- 10.2.24 Mississippi
- 10.2.25 Missouri
- 10.2.26 Montana
- 10.2.27 Nebraska
- 10.2.28 Nevada
- 10.2.29 New Hampshire
- 10.2.30 New Jersey
- 10.2.31 New Mexico
- 10.2.32 New York
- 10.2.33 North Carolina
- 10.2.34 North Dakota
- 10.2.35 Ohio
- 10.2.36 Oklahoma
- 10.2.37 Oregon
- 10.2.38 Pennsylvania
- 10.2.39 Rhode Island
- 10.2.40 South Carolina
- 10.2.41 South Dakota
- 10.2.42 Tennessee
- 10.2.43 Texas
- 10.2.44 Utah
- 10.2.45 Vermont
- 10.2.46 Virginia
- 10.2.47 Washington
- 10.2.48 West Virginia
- 10.2.49 Wisconsin
- 10.2.50 Wyoming
- 10.3 Canada
- 10.3.1 Alberta
- 10.3.2 British Columbia
- 10.3.3 Manitoba
- 10.3.4 New Brunswick
- 10.3.5 Newfoundland and Labrador
- 10.3.6 Nova Scotia
- 10.3.7 Ontario
- 10.3.8 Prince Edward Island
- 10.3.9 Quebec
- 10.3.10 Saskatchewan
- 10.3.11 Northwest Territories
- 10.3.12 Nunavut
- 10.3.13 Yukon
Chapter 11 Company Profiles
- 11.1 A123 Systems
- 11.2 Accelera
- 11.3 AESC Group
- 11.4 American Battery Solutions
- 11.5 BYD
- 11.6 CATL
- 11.7 Cenntro Inc.
- 11.8 Electric Car Parts Company
- 11.9 EVE Energy
- 11.10 Freudenberg e-Power Systems
- 11.11 Kore Power
- 11.12 LG Energy Solution Ltd.
- 11.13 Lion Electric
- 11.14 Microvast
- 11.15 Mullen Automotive
- 11.16 Octillion Energy Holdings
- 11.17 Panasonic Holdings
- 11.18 Proterra
- 11.19 Samsung SDI
- 11.20 SK Innovation

