
PUBLISHER: Global Market Insights Inc. | PRODUCT CODE: 1766178

PUBLISHER: Global Market Insights Inc. | PRODUCT CODE: 1766178
Ammonium Sulphate Market Opportunity, Growth Drivers, Industry Trend Analysis, and Forecast 2025 - 2034
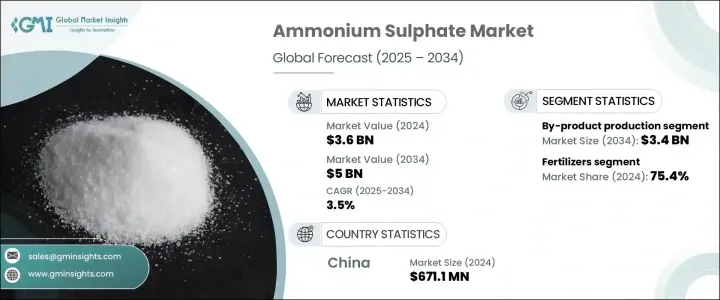
The Global Ammonium Sulphate Market was valued at USD 3.6 billion in 2024 and is estimated to grow at a CAGR of 3.5% to reach USD 5 billion by 2034. This growth is driven by the increasing need to support global food production, expanding agricultural operations, and the rising demand to secure food supply chains for a growing population. Ammonium sulphate continues to see strong traction primarily due to its critical role as a nitrogen-based fertilizer and its expanding applications across various industrial sectors. Its high solubility and efficiency in alkaline soils make it a preferred choice for enhancing crop yields, especially in rice, maize, and wheat farming. The compound's relevance is rising in developing regions, supported by governmental initiatives promoting sustainable agricultural practices.
More than 75% of global ammonium sulphate demand is attributed to fertilizer usage. In regions like Asia Pacific, especially countries such as China and India, the growing population and increased focus on arable land expansion have resulted in higher fertilizer consumption. The compound also plays a growing role in industrial fields like water treatment, pharmaceutical manufacturing, and food processing. Its application in flue gas desulfurization systems has gained significance, particularly in areas that enforce stringent air quality standards. The push toward cleaner shipping through emission control technologies has also boosted ammonium sulphate usage, as global regulations continue to tighten.
| Market Scope | |
|---|---|
| Start Year | 2024 |
| Forecast Year | 2025-2034 |
| Start Value | $3.6 Billion |
| Forecast Value | $5 Billion |
| CAGR | 3.5% |
In 2024, the by-product production method contributed USD 2.4 billion and is forecasted to reach USD 3.4 billion by 2034, maintaining a 3.5% CAGR. By-product production accounts for 68.4% share due to its cost-effectiveness and environmentally favorable use of waste streams. This method recovers ammonium sulphate during the processing of materials like coke oven gas and caprolactam, as well as during coal flue gas scrubbing. These routes lower production costs while addressing environmental concerns, especially under policies like the Industrial Emissions Directive, which promotes sulphur recovery into usable forms such as ammonium sulphate.
The fertilizer segment dominated the market in 2024, holding a 75.4% share. This segment continues to thrive as ammonium sulphate serves as an effective and low-cost nitrogen fertilizer, especially valuable in improving nutrient uptake in alkaline soils. It supports a wide range of agricultural activities at both subsistence and commercial levels. Crops like maize, rice, and other cereals benefit from its ease of use and compatibility with other fertilizers. Developing nations in Asia Pacific and Latin America are leading in its adoption, thanks to increased government subsidies and a greater shift toward modern agricultural strategies like precision farming, which enhances efficiency and minimizes waste.
China Ammonium Sulphate Market generated USD 671.1 million in 2024 and is projected to grow at a 3.6% CAGR, reaching USD 953.9 million by 2034. This market is expanding rapidly, underpinned by the country's robust agricultural output. Despite having under 10% of the world's arable land, China produces around 25% of global grain, reinforcing its heavy reliance on soil enhancers like ammonium sulphate, particularly for rice cultivation. The country also benefits from growing industrial production, and large-scale collaborations aimed at manufacturing significant volumes of compacted ammonium sulphate are boosting the sector's momentum.
Major players in the global ammonium sulfate industry include BASF SE, UBE Corporation, OCI Nitrogen, Evonik Industries AG, and Lanxess AG. Key strategies adopted by leading companies in the ammonium sulphate market focus on expanding capacity through strategic collaborations, boosting R&D for cost-efficient production technologies, and tapping into value-added industrial applications. Companies are investing in cleaner production routes, especially by-product recovery from caprolactam and coke oven processes, which allow cost savings and align with regulatory pressures for environmental sustainability. Expanding footprint in high-growth regions like Asia Pacific through joint ventures and facility expansions also remains a major priority. Additionally, key firms are strengthening their supply chains and distribution networks to ensure better service delivery and localized support, especially in emerging economies where fertilizer demand is booming.
Table of Contents
Chapter 1 Methodology & Scope
- 1.1 Market scope and definition
- 1.2 Research design
- 1.2.1 Research approach
- 1.2.2 Data collection methods
- 1.3 Data mining sources
- 1.3.1 Global
- 1.3.2 Regional/Country
- 1.4 Base estimates and calculations
- 1.4.1 Base year calculation
- 1.4.2 Key trends for market estimation
- 1.5 Primary research and validation
- 1.5.1 Primary sources
- 1.6 Forecast model
- 1.7 Research assumptions and limitations
Chapter 2 Executive Summary
- 2.1 Industry 360° synopsis
- 2.2 Key market trends
- 2.2.1 Regional
- 2.2.2 Production Method
- 2.2.3 Application
- 2.3 TAM Analysis, 2025-2034
- 2.4 CXO perspectives: Strategic imperatives
- 2.4.1 Executive decision points
- 2.4.2 Critical success factors
- 2.5 Future Outlook and Strategic Recommendations
Chapter 3 Industry Insights
- 3.1 Industry ecosystem analysis
- 3.1.1 Supplier Landscape
- 3.1.2 Profit Margin
- 3.1.3 Value addition at each stage
- 3.1.4 Factor affecting the value chain
- 3.1.5 Disruptions
- 3.2 Industry impact forces
- 3.2.1 Growth drivers
- 3.2.2 Industry pitfalls and challenges
- 3.2.3 Market opportunities
- 3.3 Growth potential analysis
- 3.4 Regulatory landscape
- 3.4.1 North America
- 3.4.2 Europe
- 3.4.3 Asia Pacific
- 3.4.4 Latin America
- 3.4.5 Middle East & Africa
- 3.5 Porter's analysis
- 3.6 PESTEL analysis
- 3.6.1 Technology and Innovation landscape
- 3.6.2 Current technological trends
- 3.6.3 Emerging technologies
- 3.7 Price trends
- 3.7.1 By region
- 3.7.2 By product form
- 3.8 Future market trends
- 3.9 Technology and Innovation landscape
- 3.9.1 Current technological trends
- 3.9.2 Emerging technologies
- 3.10 Patent Landscape
- 3.11 Trade statistics
( Note: the trade statistics will be provided for key countries only
- 3.11.1 Major importing countries
- 3.11.2 Major exporting countries
- 3.12 Sustainability and Environmental Aspects
- 3.12.1 Sustainable Practices
- 3.12.2 Waste Reduction Strategies
- 3.12.3 Energy Efficiency in Production
- 3.12.4 Eco-friendly Initiatives
- 3.13 Carbon Footprint Considerations
Chapter 4 Competitive Landscape, 2024
- 4.1 Introduction
- 4.2 Company market share analysis
- 4.2.1 By region
- 4.2.1.1 North America
- 4.2.1.2 Europe
- 4.2.1.3 Asia Pacific
- 4.2.1.4 LATAM
- 4.2.1.5 MEA
- 4.2.1 By region
- 4.3 Company matrix analysis
- 4.4 Competitive analysis of major market players
- 4.5 Competitive positioning matrix
- 4.6 Key developments
- 4.6.1 Mergers & acquisitions
- 4.6.2 Partnerships & collaborations
- 4.6.3 New Product Launches
- 4.7 Expansion Plans
Chapter 5 Market Estimates and Forecast, By Production Method, 2021 – 2034 (USD Billion) (Tons)
- 5.1 Key trends
- 5.2 Synthetic production
- 5.3 By-product production
- 5.3.1 Caprolactam production
- 5.3.2 Coke oven operations
- 5.3.3 Methyl methacrylate production
- 5.3.4 Other by-product sources
Chapter 6 Market Estimates and Forecast, By Product Form, 2021 – 2034 (USD Billion) (Tons)
- 6.1 Key trends
- 6.2 Solid
- 6.2.1 Granular
- 6.2.2 Crystalline
- 6.3 Liquid
Chapter 7 Market Estimates and Forecast, By Purity Grade, 2021 – 2034 (USD Billion) (Tons)
- 7.1 Key trends
- 7.2 Standard grade (≤99%)
- 7.3 High purity grade (>99%)
Chapter 8 Market Estimates and Forecast, By Application, 2021 – 2034 (USD Billion) (Tons)
- 8.1 Key trends
- 8.2 Fertilizers
- 8.2.1 Straight fertilizers
- 8.2.2 Compound fertilizers
- 8.2.3 Specialty fertilizers
- 8.3 Industrial applications
- 8.3.1 Textile industry
- 8.3.2 Water treatment
- 8.3.3 Food additives
- 8.3.4 Flame retardants
- 8.3.5 Chemical manufacturing
- 8.3.6 Others
- 8.4 Pharmaceutical
- 8.5 Others
Chapter 9 Market Estimates and Forecast, By Region, 2021 – 2034 (USD Billion) (Tons)
- 9.1 Key trends
- 9.2 North America
- 9.2.1 U.S.
- 9.2.2 Canada
- 9.3 Europe
- 9.3.1 Germany
- 9.3.2 UK
- 9.3.3 France
- 9.3.4 Spain
- 9.3.5 Italy
- 9.3.6 Rest of Europe
- 9.4 Asia Pacific
- 9.4.1 China
- 9.4.2 India
- 9.4.3 Japan
- 9.4.4 Australia
- 9.4.5 South Korea
- 9.4.6 Rest of Asia Pacific
- 9.5 Latin America
- 9.5.1 Brazil
- 9.5.2 Mexico
- 9.5.3 Argentina
- 9.5.4 Rest of Latin America
- 9.6 Middle East and Africa
- 9.6.1 Saudi Arabia
- 9.6.2 South Africa
- 9.6.3 UAE
- 9.6.4 Rest of Middle East and Africa
Chapter 10 Company Profiles
- 10.1 BASF SE
- 10.2 AdvanSix Inc.
- 10.3 CF Industries Holdings, Inc.
- 10.4 Domo Chemicals GmbH
- 10.5 Domo Engineering Plastics US
- 10.6 EuroChem Group AG
- 10.7 Evonik Industries AG
- 10.8 Grupa Azoty S.A.
- 10.9 Helm AG
- 10.10 Honeywell International Inc.
- 10.11 JSC Kuibyshevazot
- 10.12 Lanxess AG
- 10.13 Novus International, Inc.
- 10.14 Nutrien Ltd.
- 10.15 OCI N.V.
- 10.16 Ostchem Holding
- 10.17 Sinopec
- 10.18 Sumitomo Chemical Co., Ltd.
- 10.19 Ube Industries, Ltd.
- 10.20 Yara International ASA

