
PUBLISHER: Global Market Insights Inc. | PRODUCT CODE: 1822561

PUBLISHER: Global Market Insights Inc. | PRODUCT CODE: 1822561
North America Electric Bus Market Opportunity, Growth Drivers, Industry Trend Analysis, and Forecast 2025 - 2034
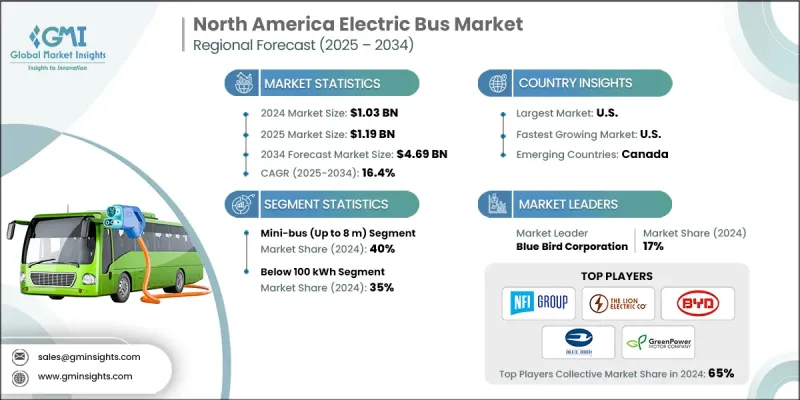
The North America Electric Bus Market was valued at USD 1.03 billion in 2024 and is estimated to grow at a CAGR of 16.4% to reach USD 4.69 billion by 2034.
Federal and state-level programs such as the U.S. Federal Transit Administration's Low or No Emission Vehicle Program are pushing public transit agencies toward fleet electrification by offering substantial grants, tax credits, and subsidies for electric buses and charging infrastructure.
| Market Scope | |
|---|---|
| Start Year | 2024 |
| Forecast Year | 2025-2034 |
| Start Value | $1.03 Billion |
| Forecast Value | $4.69 Billion |
| CAGR | 16.4% |
Increasing Demand for Mini-bus (up to 8 m)
The mini-bus (up to 8 m) segment held a notable share in 2024, owing to its versatility and suitability for last-mile transit, shuttle services, and paratransit applications. These compact electric buses offer the advantage of maneuverability in dense urban environments and smaller passenger capacities, making them ideal for routes with lower ridership or narrow streets. With growing demand for sustainable and efficient transit options, the mini-bus segment is expected to grow. Manufacturers are focusing on enhancing battery life and charging efficiency while maintaining cost-effectiveness to appeal to municipalities and private operators alike.
Rising Adoption of 100 kWh
The electric buses segment below 100 kWh segment generated significant revenues in 2024 as a popular choice for short-route operations and shuttle services where frequent recharging is feasible. These smaller battery systems reduce vehicle weight and cost, improving overall efficiency and making electric buses more accessible to smaller transit agencies and private fleets. Despite the limited range, advancements in fast-charging technology are mitigating downtime, enabling these buses to maintain consistent schedules.
Regional Insights
U.S. to Emerge as a Propelling Region
U.S. electric bus market held sizeable growth in 2024, driven by federal funding initiatives, state-level clean energy mandates, and rising environmental consciousness among consumers and policymakers. As transit agencies seek to replace aging diesel fleets with zero-emission alternatives, investments in battery technology, charging infrastructure, and fleet management systems have surged. Key industry players are leveraging innovation, strategic partnerships, and government collaborations to meet diverse regional needs and regulatory requirements, solidifying their market position and accelerating adoption.
Major players involved in the North America electric bus market are Gillig LLC, BYD Motors, Trans Tech Bus, The Lion Electric Company, Collins Bus Corporation, Van Hool, GreenPower Motor Company, Blue Bird Corporation, NFI Group, and Alexander Dennis (ADL).
Companies in the North America electric bus market are employing a blend of technological innovation, strategic alliances, and customer-centric solutions to reinforce their market presence. Emphasizing advancements in battery efficiency, vehicle range, and charging speed, they aim to differentiate their offerings in a competitive landscape. Collaborations with public transit authorities, utility providers, and infrastructure developers are pivotal to ensuring seamless integration and reliable operations.
Table of Contents
Chapter 1 Methodology
- 1.1 Research design
- 1.1.1 Research approach
- 1.1.2 Data collection methods
- 1.1.3 Base estimates and calculations
- 1.1.4 Base year calculation
- 1.1.5 Key trends for market estimates
- 1.1.6 GMI proprietary AI system
- 1.1.6.1 AI-Powered research enhancement
- 1.1.6.2 Source consistency protocol
- 1.1.6.3 AI accuracy metrics
- 1.2 Forecast model
- 1.3 Primary research and validation
- 1.3.1 Key trends for market estimates
- 1.3.2 Quantified market impact analysis
- 1.3.2.1 Mathematical impact of growth parameters on forecast
- 1.3.3 Scenario Analysis Framework
- 1.4 Some of the primary sources (but not limited to)
- 1.5 Data mining sources
- 1.5.1 Secondary
- 1.5.1.1 Paid Sources
- 1.5.1.2 Public Sources
- 1.5.1.3 Sources, by region
- 1.5.1 Secondary
- 1.6 Research Trail & Confidence Scoring
- 1.6.1 Research Trail Components
- 1.6.2 Scoring Components
- 1.7 Research transparency addendum
- 1.7.1 Source attribution framework
- 1.7.2 Quality assurance metrics
- 1.7.3 Our commitment to trust
Chapter 2 Executive Summary
- 2.1 Industry 3600 synopsis, 2021 - 2034
- 2.2 Key market trends
- 2.2.1 Country
- 2.2.2 Bus
- 2.2.3 Battery capacity
- 2.2.4 Seating capacity
- 2.2.5 Propulsion
- 2.2.6 Service
- 2.3 TAM analysis, 2025-2034
- 2.4 CXO perspectives: Strategic imperatives
- 2.4.1 Executive decision points
- 2.4.2 Critical success factors
- 2.5 Future outlook and strategic recommendations
Chapter 3 Industry Insights
- 3.1 Industry ecosystem analysis
- 3.1.1 Supplier landscape
- 3.1.2 Profit margin analysis
- 3.1.3 Cost structure
- 3.1.4 Value addition at each stage
- 3.1.5 Factor affecting the value chain
- 3.1.6 Disruptions
- 3.2 Industry impact forces
- 3.2.1 Growth drivers
- 3.2.1.1 Urbanization & public transport expansion
- 3.2.1.2 Corporate ESG goals & public image
- 3.2.1.3 Government incentives and grants
- 3.2.1.4 Emission reduction regulations
- 3.2.1.5 Rising fuel prices & operational cost savings
- 3.2.1.6 Advancements in battery technology
- 3.2.2 Industry pitfalls and challenges
- 3.2.2.1 High initial cost of electric buses
- 3.2.2.2 Limited charging infrastructure
- 3.2.3 Market opportunities
- 3.2.3.1 School bus electrification boom
- 3.2.3.2 Battery-as-a-service (BaaS) models
- 3.2.3.3 Autonomous electric buses
- 3.2.3.4 Cross-border expansion
- 3.2.1 Growth drivers
- 3.3 Growth potential analysis
- 3.4 Patent analysis
- 3.5 Regulatory landscape
- 3.5.1 Federal safety standards & regulations
- 3.5.2 SAE international standards for electric buses
- 3.5.3 IEEE standards for charging infrastructure
- 3.5.4 UL certification requirements
- 3.5.5 FTA safety & security certification process
- 3.5.6 Canadian Standards Association (CSA) requirements
- 3.5.7 Interoperability standards development
- 3.5.8 Cybersecurity standards & protocols
- 3.5.9 Battery safety & testing standards
- 3.5.10 Hydrogen safety standards for FCEBs
- 3.6 Porter's analysis
- 3.7 PESTEL analysis
- 3.8 Technology and Innovation landscape
- 3.8.1 Current technological trends
- 3.8.2 Emerging technologies
- 3.9 Sustainability and environmental aspects
- 3.9.1 Lifecycle Assessment (LCA) Analysis
- 3.9.2 Carbon footprint reduction quantification
- 3.9.3 Air quality improvement metrics
- 3.9.4 Noise pollution reduction benefits
- 3.9.5 Battery recycling & circular economy
- 3.9.6 Renewable energy integration
- 3.9.7 Water usage & environmental impact
- 3.9.8 Raw material sourcing sustainability
- 3.9.9 End-of-life vehicle management
- 3.9.10 Environmental justice & community benefits
- 3.10 Future outlook (USD Million, 2024-2034)
- 3.10.1 Market forecast & growth projections
- 3.10.2 Emerging technology trends
- 3.10.3 Next-generation battery technologies
- 3.10.4 Autonomous electric bus integration
- 3.10.5 Smart city integration opportunities
- 3.10.6 Circular economy & sustainability
- 3.10.7 Policy evolution & regulatory changes
- 3.10.8 Investment & funding outlook
- 3.10.9 Market consolidation trends
- 3.10.10 International expansion opportunities
- 3.11 Financial model analysis
- 3.11.1 Total cost of ownership (TCO) analysis
- 3.11.2 Federal funding programs & grant opportunities
- 3.11.3 State & provincial incentive programs
- 3.11.4 Public-private partnership models
- 3.11.5 Leasing & financing options
- 3.11.6 Infrastructure investment requirements
- 3.11.7 Utility partnership & rate structures
- 3.11.8 Insurance & risk management costs
- 3.11.9 Residual value & asset management
- 3.11.10 Economic impact & job creation analysis
- 3.12 Risk assessment & mitigation strategies
- 3.12.1 Technology risk assessment
- 3.12.2 Supply chain risk analysis
- 3.12.3 Infrastructure reliability risks
- 3.12.4 Regulatory & policy risks
- 3.12.5 Market adoption risk factors
- 3.12.6 Cybersecurity risk management
- 3.12.7 Weather & climate impact risks
- 3.12.8 Financial & economic risks
- 3.12.9 Operational risk mitigation
- 3.12.10 Emergency preparedness & business continuity
- 3.13 Maintenance & service ecosystem
- 3.13.1 Maintenance cost analysis & comparison
- 3.13.2 Dealer & service network development
- 3.13.3 Parts availability & supply chain
- 3.13.4 Technician training & certification
- 3.13.5 Diagnostic & monitoring systems
- 3.13.6 Warranty programs & coverage
- 3.13.7 Remote monitoring & predictive maintenance
- 3.13.8 Battery replacement & refurbishment
- 3.13.9 Infrastructure maintenance requirements
- 3.13.10 Third-party service provider ecosystem
- 3.14 Safety & security framework
- 3.14.1 Passenger safety systems & features
- 3.14.2 Driver safety & ergonomic considerations
- 3.14.3 Emergency response protocols
- 3.14.4 Fire safety & suppression systems
- 3.14.5 Cybersecurity threat assessment
- 3.14.6 Physical security measures
- 3.14.7 First responder training requirements
- 3.14.8 Accident investigation & analysis
- 3.14.9 Safety performance monitoring
- 3.14.10 Regulatory compliance & reporting
- 3.15 International benchmarking
- 3.15.1 European union market comparison
- 3.15.2 China electric bus market analysis
- 3.15.3 Technology transfer opportunities
- 3.15.4 Policy framework benchmarking
- 3.15.5 Manufacturing best practices
- 3.15.6 Infrastructure development models
- 3.15.7 Financing mechanism comparisons
- 3.15.8 Regulatory harmonization opportunities
- 3.15.9 Innovation ecosystem analysis
- 3.15.10 Lessons learned & success stories
Chapter 4 Competitive Landscape, 2024
- 4.1 Introduction
- 4.2 Company market share analysis
- 4.3 Competitive analysis of major market players
- 4.4 Competitive positioning matrix
- 4.5 Strategic outlook matrix
- 4.6 Key developments
- 4.6.1 Mergers & acquisitions
- 4.6.2 Partnerships & collaborations
- 4.6.3 New product launches
- 4.6.4 Expansion plans and funding
Chapter 5 Market Estimates & Forecast, By Bus, 2021 - 2034 (USD Mn, Units)
- 5.1 Key trends
- 5.2 Mini-bus (up to 8 m)
- 5.3 Standard city bus (9 to 12 m)
- 5.4 Articulated bus (18-24 m)
Chapter 6 Market Estimates & Forecast, By Battery Capacity, 2021 - 2034 (USD Mn, Units)
- 6.1 Key trends
- 6.2 Below 100 kWh
- 6.3 100-300 kWh
- 6.4 Above 300 kWh
Chapter 7 Market Estimates & Forecast, By Seating Capacity, 2021 - 2034 (USD Mn, Units)
- 7.1 Key trends
- 7.2 Below 40
- 7.3 40-70
- 7.4 Above 70
Chapter 8 Market Estimates & Forecast, By Propulsion, 2021 - 2034 (USD Mn, Units)
- 8.1 Key trends
- 8.2 All electric
- 8.3 Fuel-cell electric
Chapter 9 Market Estimates & Forecast, By Service, 2021 - 2034 (USD Mn, Units)
- 9.1 Key trends
- 9.2 Intercity
- 9.3 Intracity
Chapter 10 Market Estimates & Forecast, By Country, 2021 - 2034 (USD Mn, Units)
- 10.1 Key trends
- 10.2 U.S.
- 10.2.1 California
- 10.2.2 Colorado
- 10.2.3 Massachusetts
- 10.2.4 Michigan
- 10.2.5 Illinois
- 10.2.6 New Jersey
- 10.2.7 New York
- 10.2.8 Ohio
- 10.2.9 Oregon
- 10.2.10 Texas
- 10.2.11 Washington
- 10.2.12 Florida
- 10.2.13 Utah
- 10.2.14 Wisconsin
- 10.2.15 Georgia
- 10.2.16 Pennsylvania
- 10.2.17 Rest of United States
- 10.3 Canada
- 10.3.1 British Columbia
- 10.3.2 Ontario
- 10.3.3 Quebec
- 10.3.4 Manitoba
- 10.3.5 Yukon
- 10.3.6 Alberta
- 10.3.7 Rest of Canada
Chapter 11 Company Profiles
- 11.1 Global Players
- 11.1.1 BYD Motors
- 11.1.2 New Flyer Industries
- 11.1.3 Blue Bird Corporation
- 11.1.4 Proterra
- 11.1.5 Nova Bus (Volvo Group)
- 11.1.6 Gillig Corporation
- 11.1.7 Alexander Dennis (ADL)
- 11.1.8 Van Hool
- 11.1.9 Daimler
- 11.1.10 TEMSA
- 11.2 Regional Players
- 11.2.1 Lion Electric
- 11.2.2 IC Bus (Navistar)
- 11.2.3 Thomas Built Buses
- 11.2.4 Collins Bus Corporation
- 11.2.5 Micro Bird
- 11.2.6 Trans Tech Bus
- 11.2.7 ElDorado National
- 11.2.8 Starcraft Bus
- 11.2.9 Champion Bus
- 11.2.10 Creative Bus Sales
- 11.3 Emerging Players / Disruptors
- 11.3.1 Lightning eMotors
- 11.3.2 Phoenix Motorcars
- 11.3.3 Vicinity Motor Corp
- 11.3.4 GreenPower Motor
- 11.3.5 Motiv Power Systems
- 11.3.6 SEA Electric
- 11.3.7 Efficient Drivetrains Inc. (EDI)
- 11.3.8 Complete Coach Works
- 11.3.9 REV Group
- 11.3.10 Forest River Bus

