
PUBLISHER: Global Market Insights Inc. | PRODUCT CODE: 1822603

PUBLISHER: Global Market Insights Inc. | PRODUCT CODE: 1822603
Fish Protein Hydrolysate Market Opportunity, Growth Drivers, Industry Trend Analysis, and Forecast 2025 - 2034
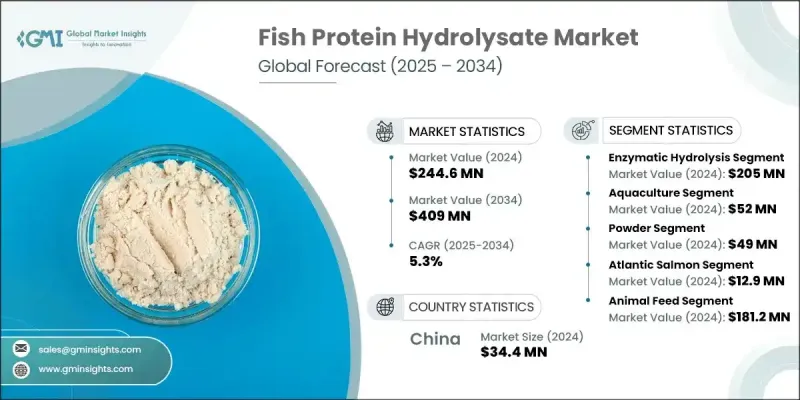
The global fish protein hydrolysate market was valued at USD 244.6 million in 2024 and is estimated to grow at a CAGR of 5.3% to reach USD 409 million by 2034. The market expansion is driven by the increasing demand for high-quality, protein-rich ingredients in animal nutrition, spurred by growing awareness of the nutritional advantages these hydrolysates provide. Rich in essential amino acids, peptides, and omega-3 fatty acids, fish protein hydrolysates enhance digestibility and support faster growth, better immune function, and overall well-being in animals and pets. The global push for more sustainable and eco-friendly protein sources has led to a greater focus on utilizing fish by-products for hydrolysate production, further boosting the market's momentum.
The rising demand for fish protein hydrolysates across multiple industries-including animal feed, aquaculture, and pet food-is a key factor driving this growth. These hydrolysates, known for their high nutritional content, have proven to be highly beneficial in improving growth performance and immune health in animals. As the global population continues to prioritize health and wellness, the market's value is being further fueled by the increasing preference for clean-label and sustainably sourced ingredients, particularly within the pet food and functional food sectors. The growing emphasis on environmental sustainability is encouraging industries to adopt alternative, eco-friendly protein sources, which plays a significant role in enhancing the adoption of fish protein hydrolysates worldwide.
| Market Scope | |
|---|---|
| Start Year | 2024 |
| Forecast Year | 2025-2034 |
| Start Value | $244.6 Million |
| Forecast Value | $409 Million |
| CAGR | 5.3% |
The fish protein hydrolysate market is segmented by production technology, with key methods including acid hydrolysis, enzymatic hydrolysis, and autolytic hydrolysis. Enzymatic hydrolysis is the fastest-growing segment, as it allows for the production of superior-quality hydrolysates with targeted functional and nutritional properties. This method, which utilizes natural enzymes, provides more control over the process, yielding peptides with enhanced bioactivity and digestibility, making it a preferred choice across various sectors.
In terms of form, fish protein hydrolysates are available in powder, liquid, and paste variations, with the powdered segment dominating the market in 2024, accounting for over 90.1% of the total revenue share. This popularity is largely due to its versatility, ease of storage, and extended shelf life. Powdered hydrolysates are especially favored in animal feed, pet food, and functional food formulations owing to their concentrated protein content and compatibility with diverse applications. The reduced risk of spoilage further increases their appeal to manufacturers and End Uses alike.
The U.S. fish protein hydrolysate market reached USD 50.7 million in 2024, driven by the demand for premium protein ingredients in the growing animal nutrition and aquaculture sectors. The strong aquaculture industry in the U.S. is fueling growth, with fish protein hydrolysates increasingly used in functional foods and dietary supplements. As consumers and businesses alike continue to prioritize sustainability and quality, the U.S. market for fish protein hydrolysates is expected to see sustained expansion in the coming years.
Table of Contents
Chapter 1 Methodology & Scope
- 1.1 Market scope and definition
- 1.2 Research design
- 1.2.1 Research approach
- 1.2.2 Data collection methods
- 1.3 Data mining sources
- 1.3.1 Global
- 1.3.2 Regional/Country
- 1.4 Base estimates and calculations
- 1.4.1 Base year calculation
- 1.4.2 Key trends for market estimation
- 1.5 Primary research and validation
- 1.5.1 Primary sources
- 1.6 Forecast model
- 1.7 Research assumptions and limitations
Chapter 2 Executive Summary
- 2.1 Industry 3600 synopsis
- 2.2 Key market trends
- 2.2.1 Regional
- 2.2.2 Technology
- 2.2.3 Form
- 2.2.4 Source
- 2.2.5 Application
- 2.2.6 Livestock
- 2.3 TAM Analysis, 2025-2034
- 2.4 CXO perspectives: Strategic imperatives
- 2.4.1 Executive decision points
- 2.4.2 Critical success factors
- 2.5 Future Outlook and Strategic Recommendations
Chapter 3 Industry Insights
- 3.1 Industry ecosystem analysis
- 3.1.1 Supplier Landscape
- 3.1.2 Profit Margin
- 3.1.3 Value addition at each stage
- 3.1.4 Factor affecting the value chain
- 3.1.5 Disruptions
- 3.2 Industry impact forces
- 3.2.1 Growth drivers
- 3.2.1.1 Rising demand for natural and sustainable feed ingredients
- 3.2.1.2 Increasing awareness of the nutritional benefits of fish protein hydrolysates
- 3.2.1.3 Shift towards premium and specialty pet food and animal feed
- 3.2.2 Industry pitfalls and challenges
- 3.2.2.1 High production costs and complex processing methods
- 3.2.2.2 Limited availability of sustainable fish raw materials
- 3.2.3 Market opportunities
- 3.2.3.1 Drives higher adoption and revenue growth in regions with growing aquaculture industries.
- 3.2.3.2 Enables entry into premium and value-added product segments.
- 3.2.1 Growth drivers
- 3.3 Growth potential analysis
- 3.4 Regulatory landscape
- 3.4.1 North America
- 3.4.2 Europe
- 3.4.3 Asia Pacific
- 3.4.4 Latin America
- 3.4.5 Middle East & Africa
- 3.5 Porter's analysis
- 3.6 PESTEL analysis
- 3.6.1 Technology and Innovation Landscape
- 3.6.2 Current technological trends
- 3.6.3 Emerging technologies
- 3.7 Price trends
- 3.7.1 By region
- 3.7.2 By product
- 3.8 Future market trends
- 3.9 Technology and Innovation Landscape
- 3.9.1 Current technological trends
- 3.9.2 Emerging technologies
- 3.10 Patent Landscape
- 3.11 Trade statistics (HS code)
- 3.11.1 Major importing countries
- 3.11.2 Major exporting countries
( Note: the trade statistics will be provided for key countries only)
- 3.12 Sustainability and Environmental Aspects
- 3.12.1 Sustainable Practices
- 3.12.2 Waste Reduction Strategies
- 3.12.3 Energy Efficiency in Production
- 3.12.4 Eco-friendly Initiatives
- 3.13 Carbon Footprint Considerations
Chapter 4 Competitive Landscape, 2024
- 4.1 Introduction
- 4.2 Company market share analysis
- 4.2.1 By region
- 4.2.1.1 North America
- 4.2.1.2 Europe
- 4.2.1.3 Asia Pacific
- 4.2.1.4 LATAM
- 4.2.1.5 MEA
- 4.2.1 By region
- 4.3 Company matrix analysis
- 4.4 Competitive analysis of major market players
- 4.5 Competitive positioning matrix
- 4.6 Key developments
- 4.6.1 Mergers & acquisitions
- 4.6.2 Partnerships & collaborations
- 4.6.3 New Product Launches
- 4.6.4 Expansion Plans
Chapter 5 Market Estimates and Forecast, By Technology, 2021 - 2034 (USD Million) (Kilo Tons)
- 5.1 Key trends
- 5.2 Acid hydrolysis
- 5.3 Autolytic hydrolysis
- 5.4 Enzymatic hydrolysis
Chapter 6 Market Estimates and Forecast, By Form, 2021 - 2034 (USD Million) (Kilo Tons)
- 6.1 Key trends
- 6.2 Powder
- 6.3 Liquid
- 6.4 Paste
Chapter 7 Market Estimates and Forecast, By Source, 2021 - 2034 (USD Million) (Kilo Tons)
- 7.1 Key trends
- 7.2 Anchovy
- 7.3 Tilapia
- 7.4 Tuna
- 7.5 Sardine
- 7.6 Atlantic salmon
- 7.7 Crustacean
- 7.8 Molluscs
- 7.9 Codfish
- 7.10 Others (herring, mackerel)
Chapter 8 Market Estimates and Forecast, By Application, 2021 - 2034 (USD Million) (Kilo Tons)
- 8.1 Key trends
- 8.2 Animal feed
- 8.3 Petfood
- 8.3.1 Cat
- 8.3.2 Dog
Chapter 9 Market Estimates and Forecast, By Livestock, 2021 - 2034 (USD Million) (Kilo Tons)
- 9.1 Key trends
- 9.2 Poultry
- 9.2.1 Broilers
- 9.2.2 Layers
- 9.3 Swine
- 9.4 Calves
- 9.5 Aquaculture
- 9.5.1 Salmon
- 9.5.2 Trouts
- 9.5.3 Shrimps
- 9.5.4 Others (oysters, crabs, lobsters)
- 9.6 Equine
Chapter 10 Market Estimates and Forecast, By Region, 2021 - 2034 (USD Million) (Kilo Tons)
- 10.1 Key trends
- 10.2 North America
- 10.2.1 U.S.
- 10.2.2 Canada
- 10.3 Europe
- 10.3.1 Germany
- 10.3.2 UK
- 10.3.3 France
- 10.3.4 Spain
- 10.3.5 Italy
- 10.3.6 Rest of Europe
- 10.4 Asia Pacific
- 10.4.1 China
- 10.4.2 India
- 10.4.3 Japan
- 10.4.4 Australia
- 10.4.5 South Korea
- 10.4.6 Rest of Asia Pacific
- 10.5 Latin America
- 10.5.1 Brazil
- 10.5.2 Mexico
- 10.5.3 Argentina
- 10.5.4 Rest of Latin America
- 10.6 Middle East and Africa
- 10.6.1 Saudi Arabia
- 10.6.2 South Africa
- 10.6.3 UAE
- 10.6.4 Rest of Middle East and Africa
Chapter 11 Company Profiles
- 11.1 Alaska Protein Recovery
- 11.2 Bio-Marine Ingredients Ireland
- 11.3 Copalis Sea
- 11.4 Diana Aqua
- 11.5 Hofseth Biocare
- 11.6 Janatha Fish Meal & Oil Products
- 11.7 Nutrifish
- 11.8 Omega Protein
- 11.9 Rossyew
- 11.10 SAMPI
- 11.11 Scanbio Marine
- 11.12 Sociedad Pesquera Landes
- 11.13 SOPROPECHE
- 11.14 TC Union
- 11.15 Triplenine

