
PUBLISHER: Global Market Insights Inc. | PRODUCT CODE: 1822612

PUBLISHER: Global Market Insights Inc. | PRODUCT CODE: 1822612
Floating Power Plants Market Opportunity, Growth Drivers, Industry Trend Analysis, and Forecast 2025 - 2034
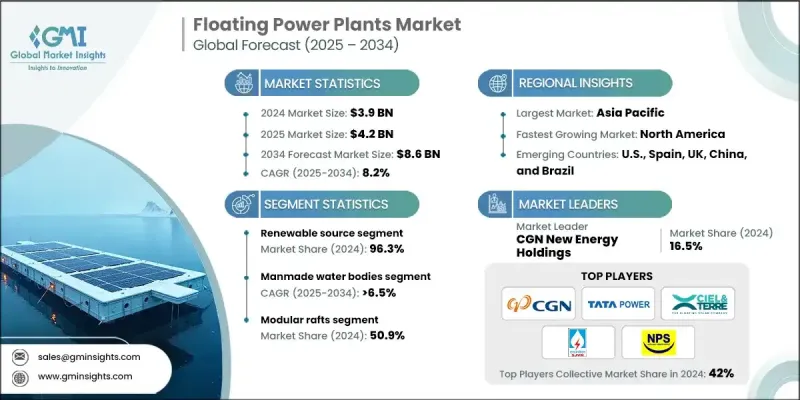
The global floating power plants market was valued at USD 3.9 billion in 2024 and is projected to grow from USD 4.2 billion in 2025 to USD 8.6 billion by 2034, expanding at a CAGR of 8.2%, according to the latest report published by Global Market Insights, Inc.
Floating power plants (FPPs) are on the rise as fast, deployable, flexible options to meet energy needs in regions with an abundance of water but a limited amount of land. These plants provide the ability to integrate renewable sources, lower transmission losses, and modulate load requirements without the need for large amounts of land.
| Market Scope | |
|---|---|
| Start Year | 2024 |
| Forecast Year | 2025-2034 |
| Start Value | $3.9 Billion |
| Forecast Value | $8.6 Billion |
| CAGR | 8.2% |
Key Drivers:
1. Emphasis on renewable energy integration: The emergence of floating solar/wind platforms allows countries to achieve clean energy goals without competing for limited land resources.
2. Need for fast deployment in offshore and island areas: The ability for FPPs to provide resilient energy to disadvantaged coastal and island communities without grid extension is immeasurable.
3. Land limitations and waterbody utilization issue: The public sector is pushing to use manmade lakes and reservoirs to produce clean power.
4. Modular and hybrid technology advancements: The advancement of hybrid floating producing platforms, which use solar, wind, and storage, is transforming the implementation of utility-scale renewables.
Key Players:
- The 5 leading players in the floating power plants market are CGN New Energy Holdings, Tata Power, Ciel & Terre, SJVN Green Energy, and National Power Supply Public Company, accounting for approximately 42% of the 2024 market.
- In quarter 3 FY 2025, Siemens Energy announced strong financial performance in the third quarter with revenue increasing by 13.5% on a comparable basis to USD 11.3 billion.
- In the first half of 2025, GE Vernova reported revenue of USD 17.1 billion.
- In Q3, 2025, Kawasaki Heavy Industries garnered revenue of USD 3.3 billion.
Key Challenges:
- High capital costs of deployment: The benefits of modularity have lessened costs, but the costs for the mooring and installation systems are still high for the first time.
- Environmental and regulatory requirements: This includes permitting and water rights related to site and environmental issues that may affect deployment, especially in sensitive marine habitats.
- Maintenance and mooring in all types of extreme weather: Offshore floating structures need to factor in saltwater corrosion and exposure to wind and wave conditions at all times.
1. By Power Source - Renewable Leading
Renewable floating power plants (especially solar and wind) dominated the market share in 2024. Increasingly rigorous environmental regulations and decarbonization goals are pushing utilities towards hybrid and solar-led floating generation technologies.
2. By Application - Manmade Water Bodies are at the Forefront
Due to simple permitting and consistent, steady water levels, manmade water bodies such as reservoirs, ponds, artificial lakes, and canals were the most prominent deployment locations. These job sites minimize potential complications around tides and wind wave action, preserving long-term FPP viability.
3. By Deployment - Modular Rafts Provide Mobilization
Modular raft systems were the most dominant system in the market in 2024. They offer mobilization and mobilization to units with standardization manufacturing, making these units valuable at both utility scale for grid situations as well as for rural electrification projects. Validation in this approach is also realized with lower maintenance and shorter times to upgrade.
With aspirational ambitions for clean energy, North America is being identified as a rapidly growing market. Onshore and offshore wind (U.S. East Coast), reservoir-based floating solar (California, Texas), and other segments are driving the floating power capacity of the region.
Key vendors in the floating power plants market are BW Ideol, CGN New Energy Holdings, CHN Energy, Ciel & Terre, Electricity Generating Authority of Thailand, Equinor, Floating Power Plant, GE Vernova, HEXA Renewables, Karadeniz Holding, Kawasaki Heavy Industries, MAN Energy Solutions, Mitsubishi Heavy Industries, National Power Supply Public Company, Orsted, RWE, Siemens Energy, SJVN Green Energy, Sterling & Wilson Renewable Energy, Swimsol, Tata Power, Vestas, and Wartsila.
To promote competitiveness, leading players are emphasizing hybrid systems, global partnerships, and scalable modular designs. BW Ideol and Equinor are increasing floating offshore wind capacity across Europe and North America. Karadeniz Holding is still sending its "Power Ships" out for emergency power supply in emerging markets. GE Vernova and Siemens Energy are emphasizing integrating floating renewables with gas turbines and battery storage. Collaborations like the one between Vestas and Mitsubishi Heavy Industries are driving wind-turbine-integrated floating platforms. Firms are also entering the manmade water bodies space with locally adapted deployments designed to meet regional regulatory and climatic requirements.
Table of Contents
Chapter 1 Methodology & Scope
- 1.1 Research design
- 1.1.1 Research approach
- 1.1.2 Data collection methods
- 1.1.3 Base estimates and calculations
- 1.1.4 Base year calculation
- 1.1.5 Key trends for market estimates
- 1.2 Forecast model
- 1.3 Primary research and validation
- 1.4 Some of the primary sources (but not limited to)
- 1.5 Data mining sources
- 1.5.1 Secondary
- 1.5.1.1 Paid sources
- 1.5.1.2 Public sources
- 1.5.1.3 Sources, by region
- 1.5.1 Secondary
- 1.6 Market definitions
Chapter 2 Executive Summary
- 2.1 Industry 360° synopsis, 2021 - 2034
- 2.2 Business trends
- 2.3 Power source trends
- 2.4 Capacity trends
- 2.5 Deployment trends
- 2.6 Application trends
- 2.7 Regional trends
Chapter 3 Industry Insights
- 3.1 Industry ecosystem analysis
- 3.1.1 Raw material availability & sourcing analysis
- 3.1.2 Manufacturing capacity assessment
- 3.1.3 Supply chain resilience & risk factors
- 3.1.4 Distribution network analysis
- 3.2 Regulatory landscape
- 3.3 Industry impact forces
- 3.3.1 Growth drivers
- 3.3.2 Industry pitfalls & challenges
- 3.4 Growth potential analysis
- 3.5 Porter's analysis
- 3.5.1 Bargaining power of suppliers
- 3.5.2 Bargaining power of buyers
- 3.5.3 Threat of new entrants
- 3.5.4 Threat of substitutes
- 3.6 PESTEL analysis
- 3.6.1 Political factors
- 3.6.2 Economic factors
- 3.6.3 Social factors
- 3.6.4 Technological factors
- 3.6.5 Legal factors
- 3.6.6 Environmental factors
- 3.7 Cost structure analysis of floating power plants
- 3.8 Price trend analysis
- 3.8.1 By region
- 3.8.2 By capacity
- 3.9 Emerging opportunities & trends
- 3.9.1 Digitalization and IoT integration
- 3.9.2 Emerging market penetration
- 3.10 Investment analysis & future outlook
Chapter 4 Competitive Landscape, 2025
- 4.1 Introduction
- 4.2 Company market share analysis, by region, 2024
- 4.2.1 North America
- 4.2.2 Europe
- 4.2.3 Asia Pacific
- 4.2.4 Middle East & Africa
- 4.2.5 Latin America
- 4.3 Strategic dashboard
- 4.4 Strategic initiatives
- 4.4.1 Key partnerships & collaborations
- 4.4.2 Major M&A activities
- 4.4.3 Product innovations & launches
- 4.4.4 Market expansion strategies
- 4.5 Competitive benchmarking
- 4.6 Innovation & technology landscape
Chapter 5 Market Size and Forecast, By Power Source, 2021 - 2034 (USD Million & MW)
- 5.1 Key trends
- 5.2 Renewable
- 5.2.1 Solar
- 5.2.2 Wind
- 5.3 Non-renewable
- 5.3.1 Gas turbine
- 5.3.2 IC engines
Chapter 6 Market Size and Forecast, By Capacity, 2021 - 2034 (USD Million & MW)
- 6.1 Key trends
- 6.2 > 1 - 5 MW
- 6.3 > 5 - 20 MW
- 6.4 > 20 - 100 MW
- 6.5 > 100 MW
Chapter 7 Market Size and Forecast, By Deployment, 2021 - 2034 (USD Million & MW)
- 7.1 Key trends
- 7.2 Ships
- 7.3 Barges
- 7.4 Modular rafts
- 7.5 Others
Chapter 8 Market Size and Forecast, By Application, 2021 - 2034 (USD Million & MW)
- 8.1 Key trends
- 8.2 Manmade water bodies
- 8.3 Natural water bodies
Chapter 9 Market Size and Forecast, By Region, 2021 - 2034 (USD Million & MW)
- 9.1 Key trends
- 9.2 North America
- 9.2.1 U.S.
- 9.2.2 Canada
- 9.2.3 Mexico
- 9.3 Europe
- 9.3.1 UK
- 9.3.2 Germany
- 9.3.3 France
- 9.3.4 Spain
- 9.4 Asia Pacific
- 9.4.1 China
- 9.4.2 India
- 9.4.3 Japan
- 9.4.4 Australia
- 9.5 Middle East & Africa
- 9.5.1 UAE
- 9.5.2 Saudi Arabia
- 9.6 Latin America
- 9.6.1 Brazil
- 9.6.2 Argentina
Chapter 10 Company Profiles
- 10.1 BW Ideol
- 10.2 CGN New Energy Holdings
- 10.3 CHN Energy
- 10.4 Ciel & Terre
- 10.5 Electricity Generating Authority of Thailand
- 10.6 Equinor
- 10.7 Floating Power Plant
- 10.8 GE Vernova
- 10.9 HEXA Renewables
- 10.10 Karadeniz Holding
- 10.11 Kawasaki Heavy Industries
- 10.12 MAN Energy Solutions
- 10.13 Mitsubishi Heavy Industries
- 10.14 National Power Supply Public Company
- 10.15 Ørsted
- 10.16 RWE
- 10.17 Siemens Energy
- 10.18 SJVN Green Energy
- 10.19 Sterling & Wilson Renewable Energy
- 10.20 Swimsol
- 10.21 Tata Power
- 10.22 Vestas
- 10.23 Wartsila

