
PUBLISHER: Global Market Insights Inc. | PRODUCT CODE: 1833384

PUBLISHER: Global Market Insights Inc. | PRODUCT CODE: 1833384
Commercial Display Market Opportunity, Growth Drivers, Industry Trend Analysis, and Forecast 2025 - 2034
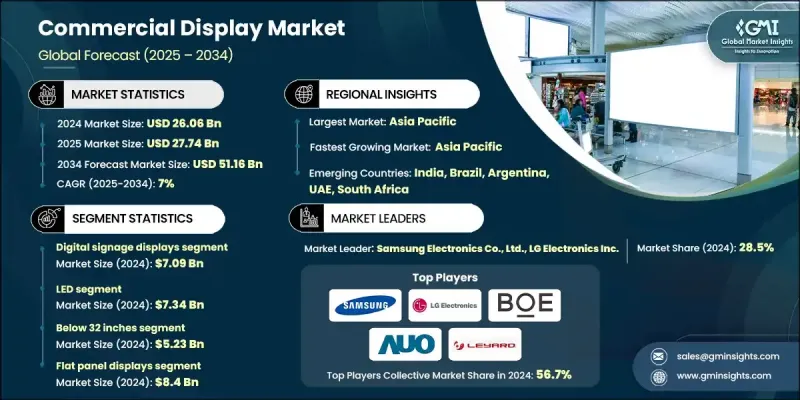
The Global Commercial Display Market was valued at USD 26.06 billion in 2024 and is estimated to grow at a CAGR of 7% to reach USD 51.16 billion by 2034.
This growth trajectory is fueled by the expanding role of commercial displays in digital infrastructure, especially within sectors like education and healthcare, where interactive and intelligent display solutions are transforming engagement and communication. As institutions modernize their operations and public service frameworks, the need for dynamic, real-time content delivery systems becomes essential. Smart displays are now seen as critical tools not just in retail and advertising, but increasingly in public-facing services. This is encouraging adoption across broader verticals. Moreover, the growing shift toward immersive and personalized experiences in customer-facing environments such as corporate lobbies, campuses, and transportation hubs is redefining the scope of display technologies and contributing to this sustained market momentum.
| Market Scope | |
|---|---|
| Start Year | 2024 |
| Forecast Year | 2025-2034 |
| Start Value | $26.06 billion |
| Forecast Value | $51.16 Billion |
| CAGR | 7% |
The digital signage displays segment generated USD 7.09 billion in 2024, making it the most prominent product category within the commercial display industry. This segment continues to thrive due to high demand for adaptable content delivery platforms across industries like transportation, retail, and enterprise communications. As urban infrastructure evolves to support more intelligent environments, investments in large-format signage and information systems have grown rapidly. These displays allow businesses and institutions to deliver location-based content, event notifications, and interactive messages with ease.
The LED displays segment generated USD 7.34 billion in 2024. Their widespread popularity stems from their high energy efficiency, durability, and performance versatility across indoor and outdoor environments. The LED segment continues to dominate because of its scalability for video walls, signage systems, and high-resolution advertising. From transportation terminals to city centers and retail storefronts, LED displays are becoming the preferred solution for businesses looking to capture attention in both high-traffic and ambient light environments. Their adaptability and long service life make them particularly appealing for continuous-use settings.
U.S. Commercial Display Market generated USD 5.57 billion in 2024, supported by a CAGR of 7.5% through 2034. The country continues to lead in adoption due to widespread integration in industries such as quick-service restaurants, retail chains, public transit, and entertainment venues. Increasing regulatory guidance around accessibility and public information standards further accelerates deployment in educational institutions, airports, and government buildings. These developments drive demand for advanced display systems that support real-time communication, safety updates, and interactive navigation, offering both functionality and compliance with modern digital infrastructure requirements.
Major companies shaping the Global Commercial Display Market include Panasonic Corporation, Sony Corporation, Hisense Visual Technology Co., Ltd., BenQ Corporation, Daktronics, Inc., Samsung Electronics Co., Ltd., Qisda Corporation, Sharp Corporation, NEC Corporation, E Ink Holdings Inc., Barco NV, Christie Digital Systems USA, Inc., LG Electronics Inc., Delta Electronics, Inc., ViewSonic Corporation, Leyard Optoelectronic Co., Ltd., AU Optronics Corp., Mitsubishi Electric Corporation, Planar Systems, Inc., BOE Technology Group Co., Ltd., Elo Touch Solutions, Inc., Shenzhen Absen Optoelectronic Co., Ltd., and Innolux Corporation.
Leading companies in the commercial display industry are investing heavily in next-generation technologies such as micro-LED, OLED, and interactive touchscreens to cater to evolving customer demands. Many focus on expanding their product portfolios to include energy-efficient, modular, and ultra-HD display systems tailored for smart retail, public infrastructure, and enterprise environments. Strategic collaborations with tech firms and government bodies are also common, enabling players to participate in national digital transformation programs.
Table of Contents
Chapter 1 Methodology and Scope
- 1.1 Market scope and definition
- 1.2 Research design
- 1.2.1 Research approach
- 1.2.2 Data collection methods
- 1.3 Data mining sources
- 1.3.1 Global
- 1.3.2 Regional/Country
- 1.4 Base estimates and calculations
- 1.4.1 Base year calculation
- 1.4.2 Key trends for market estimation
- 1.5 Primary research and validation
- 1.5.1 Primary sources
- 1.6 Forecast model
- 1.7 Research assumptions and limitations
Chapter 2 Executive Summary
- 2.1 Industry 360° synopsis
- 2.2 Key market trends
- 2.2.1 Business trends
- 2.2.2 Product type trends
- 2.2.3 Technology trends
- 2.2.4 Display Size trends
- 2.2.5 Panel Type trends
- 2.2.6 End Use trends
- 2.2.7 Regional trends
- 2.3 TAM Analysis, 2025-2034 (USD Billion)
- 2.4 CXO perspectives: Strategic imperatives
- 2.5 Executive decision points
- 2.6 Critical Success Factors
- 2.7 Future Outlook and Strategic Recommendations
Chapter 3 Industry Insights
- 3.1 Industry ecosystem analysis
- 3.1.1 Supplier Landscape
- 3.1.2 Profit Margin
- 3.1.3 Cost structure
- 3.1.4 Value addition at each stage
- 3.1.5 Factor affecting the value chain
- 3.1.6 Disruptions
- 3.2 Industry impact forces
- 3.2.1 Growth drivers
- 3.2.1.1 Escalating demand for digital signage across retail, hospitality, and transportation
- 3.2.1.2 Adoption of high-resolution displays (4K/8K) and advanced technologies (OLED, microLED)
- 3.2.1.3 Integration of AI and cloud-based content management
- 3.2.1.4 Growth in smart city infrastructure and public service automation
- 3.2.1.5 Rising use of interactive displays in education and healthcare
- 3.2.2 Industry pitfalls and challenges
- 3.2.2.1 Supply chain disruptions and high production costs
- 3.2.2.2 Shortage of skilled professionals for installation and maintenance
- 3.2.3 Market Opportunities
- 3.2.3.1 Expansion in smart cities and transportation hubs
- 3.2.3.2 Integration with building management and POS systems
- 3.2.3.3 Growth in SaaS-based content platforms
- 3.2.3.4 Adoption in healthcare and automotive sectors
- 3.2.1 Growth drivers
- 3.3 Growth potential analysis
- 3.4 Regulatory landscape
- 3.4.1 North America
- 3.4.2 Europe
- 3.4.3 Asia Pacific
- 3.4.4 Latin America
- 3.4.5 Middle East & Africa
- 3.5 Porter’s analysis
- 3.6 PESTEL analysis
- 3.7 Technological and Innovation landscape
- 3.7.1 Current technological trends
- 3.7.2 Emerging technologies
- 3.8 Price Trends
- 3.8.1 By region
- 3.8.2 By product
- 3.9 Pricing strategies
- 3.10 Emerging business models
- 3.11 Compliance requirements
- 3.12 Sustainability measures
- 3.13 Consumer sentiment analysis
- 3.14 Patent and IP analysis
- 3.15 Geopolitical and trade dynamics
Chapter 4 Competitive Landscape, 2024
- 4.1 Introduction Company market share analysis
- 4.2 Company market share analysis
- 4.2.1 By region
- 4.2.1. North America
- 4.2.2. Europe
- 4.2.3. Asia Pacific
- 4.2.2 Market concentration analysis
- 4.3 Competitive Benchmarking of key Players
- 4.3.1 Financial Performance Comparison
- 4.3.1.1. Revenue
- 4.3.1.2. Profit Margin
- 4.3.1.3. R&D
- 4.3.2 Product Portfolio Comparison
- 4.3.2.1. Product Range Breadth
- 4.3.2.2. Technology
- 4.3.2.3. Innovation
- 4.3.3 Geographic Presence Comparison
- 4.3.3.1. Global Footprint Analysis
- 4.3.3.2. Service Network Coverage
- 4.3.3.3. Market Penetration by Region
- 4.3.4 Competitive Positioning Matrix
- 4.3.4.1. Leaders
- 4.3.4.2. Challengers
- 4.3.4.3. Followers
- 4.3.4.4. Niche Players
- 4.3.5 Strategic outlook matrix
- 4.3.1 Financial Performance Comparison
- 4.4 Key developments, 2021-2024
- 4.4.1 Mergers and Acquisitions
- 4.4.2 Partnerships and Collaborations
- 4.4.3 Technological Advancements
- 4.4.4 Expansion and Investment Strategies
- 4.4.5 Sustainability Initiatives
- 4.4.6 Digital Transformation Initiatives
- 4.5 Emerging/ Startup Competitors Landscape
Chapter 5 Market Estimates & Forecast, By Product Type, 2021 - 2034 (USD Billion & Units)
- 5.1 Key trends
- 5.2 Digital signage displays
- 5.3 Interactive whiteboards
- 5.4 Video walls
- 5.5 Kiosks
- 5.6 Others
Chapter 6 Market estimates & forecast, By Technology, 2021 - 2034 (USD Billion & Units)
- 6.1 Key trends
- 6.2 LED
- 6.3 LCD
- 6.4 OLED
- 6.5 Others
Chapter 7 Market estimates & forecast, By Display Size, 2021 - 2034 (USD Billion & Units)
- 7.1 Key trends
- 7.2 Below 32 inches
- 7.3 32-52 inches
- 7.4 Above 52 inches
Chapter 8 Market Estimates and Forecast, By Panel Type, 2021-2034 ( USD Billion & Units)
- 8.1 Key trends
- 8.2 Flat panel displays (FPD)
- 8.3 Curved panel displays
- 8.4 Flexible/transparent displays
Chapter 9 Market Estimates and Forecast, By End Use, 2021-2034 ( USD Billion & Units)
- 9.1 Key trends
- 9.2 Hospitality
- 9.3 Retail
- 9.4 Transportation
- 9.5 Healthcare
- 9.6 Banking & financial services
- 9.7 Others
Chapter 10 Market Estimates and Forecast, By Region, 2021 - 2034 (USD Billion & Units)
- 10.1 Key trends
- 10.2 North America
- 10.2.1 U.S.
- 10.2.2 Canada
- 10.3 Europe
- 10.3.1 Germany
- 10.3.2 U.K.
- 10.3.3 France
- 10.3.4 Italy
- 10.3.5 Spain
- 10.3.6 Netherlands
- 10.4 Asia Pacific
- 10.4.1 China
- 10.4.2 India
- 10.4.3 Japan
- 10.4.4 South Korea
- 10.4.5 Australia
- 10.5 Latin America
- 10.5.1 Brazil
- 10.5.2 Mexico
- 10.5.3 Argentina
- 10.6 Middle East & Africa
- 10.6.1 UAE
- 10.6.2 Saudi Arabia
- 10.6.3 South Africa
Chapter 11 Company Profile
- 11.1 Global Players:
- 11.1.1 AU Optronics Corp.
- 11.1.2 BenQ Corporation
- 11.1.3 BOE Technology Group Co., Ltd.
- 11.1.4 Leyard Optoelectronic Co., Ltd.
- 11.1.5 LG Electronics Inc.
- 11.1.6 Mitsubishi Electric Corporation
- 11.1.7 NEC Corporation
- 11.1.8 Panasonic Corporation
- 11.1.9 Samsung Electronics Co., Ltd.
- 11.1.10 Sharp Corporation
- 11.1.11 Sony Corporation
- 11.2 Regional Players:
- 11.2.1 Barco NV
- 11.2.2 Christie Digital Systems USA, Inc.
- 11.2.3 Daktronics, Inc.
- 11.2.4 Delta Electronics, Inc.
- 11.2.5 Innolux Corporation
- 11.2.6 Planar Systems, Inc.
- 11.2.7 ViewSonic Corporation
- 11.3 Emerging Players:
- 11.3.1 E Ink Holdings Inc.
- 11.3.2 Elo Touch Solutions, Inc.
- 11.3.3 Hisense Visual Technology Co., Ltd.
- 11.3.4 Qisda Corporation
- 11.3.5 Shenzhen Absen Optoelectronic Co., Ltd.

