
PUBLISHER: Global Market Insights Inc. | PRODUCT CODE: 1871126

PUBLISHER: Global Market Insights Inc. | PRODUCT CODE: 1871126
Bioactive Peptide from Food Waste Market Opportunity, Growth Drivers, Industry Trend Analysis, and Forecast 2025 - 2034
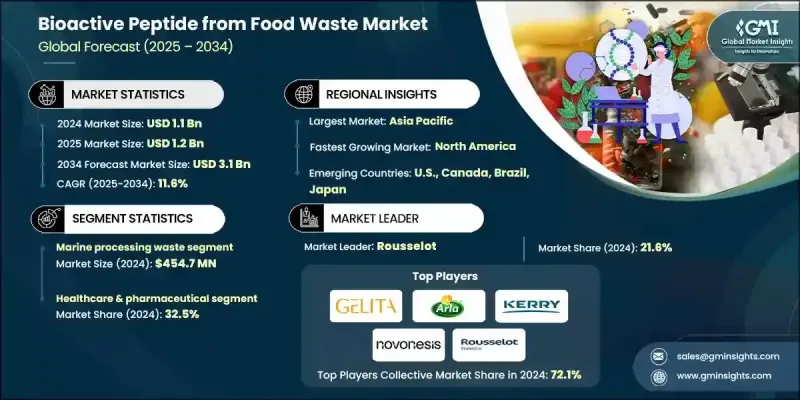
The Global Bioactive Peptide from Food Waste Market was valued at USD 1.1 Billion in 2024 and is estimated to grow at a CAGR of 11.6% to reach USD 3.1 Billion by 2034.
Bioactive peptides obtained from food processing residues and discarded raw materials are increasingly being utilized to develop health-promoting products, including nutraceuticals, pharmaceuticals, and functional foods. Growing attention toward sustainability and environmental protection has encouraged industries to adopt waste valorization strategies that align with circular economy goals. Governments across the world are introducing supportive regulations to promote food waste reduction and its conversion into value-added products. The use of eco-friendly extraction methods, such as enzymatic hydrolysis and advanced green technologies, is transforming the production of these peptides by enhancing yield, improving purity, and lowering environmental impact. These innovations are driving demand as they align with clean-label and sustainability preferences among consumers. Bioactive peptides from food waste are gaining traction in functional food applications due to their proven health-promoting properties, such as antioxidant, antimicrobial, and anti-inflammatory activities. Rising consumer awareness around preventive health has motivated manufacturers to develop advanced formulations that cater to the growing demand for natural and effective wellness solutions.
| Market Scope | |
|---|---|
| Start Year | 2024 |
| Forecast Year | 2025-2034 |
| Start Value | $1.1 Billion |
| Forecast Value | $3.1 Billion |
| CAGR | 11.6% |
The marine processing waste segment generated USD 454.7 million in 2024. This category, comprising fish, aquaculture, and shellfish residues, is rich in bioactive molecules, making it an essential source for high-purity peptide production. These compounds are increasingly used in industries such as nutraceuticals, cosmetics, and functional foods because of their high nutritional and therapeutic potential.
The healthcare and pharmaceutical segment accounted for a 32.5% share in 2024. This dominance is attributed to the growing use of bioactive peptides in drug development, medical nutrition, and clinical formulations aimed at managing chronic diseases. Increasing demand from aging populations and health-focused consumers has further strengthened the adoption of bioactive compounds with anti-inflammatory, antihypertensive, and antioxidant effects.
North America Bioactive Peptide from Food Waste Market will grow at a CAGR of 11.5% between 2025 and 2034. Market growth is supported by the rising preference for natural, healthy, and sustainable food ingredients. As health-conscious consumers increasingly seek functional foods, supplements, and nutraceutical products, manufacturers in the region are investing in bioactive peptide integration within food and beverage innovations.
Leading companies operating in Bioactive Peptide from Food Waste Market include Arla Foods Ingredients Group, DSM-Firmenich, Fonterra (NZMP), GELITA, Glanbia plc, Kerry Group plc, Novonesis, PB Leiner, Rousselot, and Tessenderlo Group. Companies are focusing on strategic collaborations, sustainable product innovations, and advanced extraction technologies to enhance their market presence. Leading manufacturers are investing in green production methods to improve peptide quality and minimize environmental impact. Many firms are strengthening their R&D capabilities to expand product portfolios catering to health-focused applications. Partnerships with food processors and biotech firms are also enabling efficient utilization of waste materials. Additionally, market players are adopting branding strategies centered on sustainability and clean-label claims to attract eco-conscious consumers.
Table of Contents
Chapter 1 Methodology & Scope
- 1.1 Market scope and definition
- 1.2 Research design
- 1.2.1 Research approach
- 1.2.2 Data collection methods
- 1.3 Data mining sources
- 1.3.1 Global
- 1.3.2 Regional/Country
- 1.4 Base estimates and calculations
- 1.4.1 Base year calculation
- 1.4.2 Key trends for market estimation
- 1.5 Primary research and validation
- 1.5.1 Primary sources
- 1.6 Forecast model
- 1.7 Research assumptions and limitations
Chapter 2 Executive Summary
- 2.1 Industry 3600 synopsis
- 2.2 Key market trends
- 2.2.1 Source trends
- 2.2.2 End use industry trends
- 2.2.3 Regional trends
- 2.3 TAM Analysis, 2025-2034
- 2.4 CXO perspectives: strategic imperatives
- 2.4.1 Executive decision points
- 2.4.2 Critical success factors
- 2.5 Future outlook and strategic recommendations
Chapter 3 Industry Insights
- 3.1 Industry ecosystem analysis
- 3.1.1 Supplier landscape
- 3.1.2 Profit margin
- 3.1.3 Value addition at each stage
- 3.1.4 Factor affecting the value chain
- 3.1.5 Disruptions
- 3.2 Industry impact forces
- 3.2.1 Growth drivers
- 3.2.1.1 Growing focus on circular economy & waste valorization
- 3.2.1.2 Rising demand for natural & clean-label ingredients
- 3.2.1.3 Supportive regulatory framework for food waste utilization
- 3.2.2 Industry pitfalls and challenges
- 3.2.2.1 Consumer perception issues with waste-derived ingredients
- 3.2.2.2 Quality control & contamination management
- 3.2.3 Market opportunities
- 3.2.3.1 Untapped food waste streams in emerging markets
- 3.2.3.2 Integration with personalized nutrition trends
- 3.2.1 Growth drivers
- 3.3 Growth potential analysis
- 3.4 Regulatory landscape
- 3.4.1 North America
- 3.4.2 Europe
- 3.4.3 Asia Pacific
- 3.4.4 Latin America
- 3.4.5 Middle East & Africa
- 3.5 Porter's analysis
- 3.6 PESTEL analysis
- 3.7 Technology and Innovation landscape
- 3.7.1 Current technological trends
- 3.7.2 Emerging technologies
- 3.8 Price trends
- 3.8.1 By region
- 3.8.2 By source
- 3.9 Future market trends
- 3.10 Patent Landscape
- 3.11 Trade statistics (HS code) ( Note: the trade statistics will be provided for key countries only)
- 3.11.1 Major importing countries
- 3.11.2 Major exporting countries
- 3.12 Sustainability and environmental aspects
- 3.12.1 Sustainable practices
- 3.12.2 Waste reduction strategies
- 3.12.3 Energy efficiency in production
- 3.12.4 Eco-friendly initiatives
- 3.13 Carbon footprint consideration
Chapter 4 Competitive Landscape, 2024
- 4.1 Introduction
- 4.2 Company market share analysis
- 4.2.1 By region
- 4.2.1.1 North America
- 4.2.1.2 Europe
- 4.2.1.3 Asia Pacific
- 4.2.1.4 LATAM
- 4.2.1.5 MEA
- 4.2.1 By region
- 4.3 Company matrix analysis
- 4.4 Competitive analysis of major market players
- 4.5 Competitive positioning matrix
- 4.6 Key developments
- 4.6.1 Mergers & acquisitions
- 4.6.2 Partnerships & collaborations
- 4.6.3 New product launches
- 4.6.4 Expansion plans
Chapter 5 Market Estimates and Forecast, By Source, 2021-2034 (USD Million) (Kilo Tons)
- 5.1 Key trends
- 5.2 Dairy waste streams
- 5.2.1 Whey processing residues
- 5.2.2 Cheese manufacturing byproducts
- 5.2.3 Milk processing waste
- 5.3 Meat processing byproducts
- 5.3.1 Blood & plasma fractions
- 5.3.2 Skin & hide processing waste
- 5.3.3 Bone & cartilage residues
- 5.3.4 Organ meat processing byproducts
- 5.4 Marine processing waste
- 5.4.1 Fish processing residues
- 5.4.2 Shellfish processing byproducts
- 5.4.3 Aquaculture waste streams
- 5.5 Plant protein residues
- 5.5.1 Oilseed processing meals
- 5.5.2 Grain processing byproducts
- 5.5.3 Pulse processing residues
- 5.5.4 Fruit & vegetable processing waste
Chapter 6 Market Estimates and Forecast, By End Use Industry, 2021-2034 (USD Million) (Kilo Tons)
- 6.1 Key trends
- 6.2 Healthcare & pharmaceutical
- 6.2.1 Nutraceutical & dietary supplement
- 6.2.2 Therapeutic drug development
- 6.2.3 Medical nutrition
- 6.2.4 Clinical research & development
- 6.2.5 Over-the-counter (OTC) medicine
- 6.3 Food & beverage
- 6.3.1 Functional food ingredient
- 6.3.2 Protein fortification
- 6.3.3 Natural preservative
- 6.3.4 Flavor enhancement
- 6.3.5 Fermented product
- 6.3.6 Beverage fortification
- 6.4 Personal care & cosmetics
- 6.4.1 Anti-aging skincare
- 6.4.2 Moisturizing & hydration
- 6.4.3 Hair care & scalp health
- 6.4.4 Wound care & healing
- 6.4.5 Sun protection
- 6.4.6 Men's grooming
- 6.5 Animal feed & nutrition
- 6.5.1 Aquaculture feed
- 6.5.2 Livestock feed supplement
- 6.5.3 Pet food & treats
- 6.5.4 Poultry feed
- 6.5.5 Swine feed
- 6.5.6 Ruminant feed
- 6.6 Agriculture & biotechnology
- 6.6.1 Bio-stimulant
- 6.6.2 Plant growth promoter
- 6.6.3 Soil health enhancement
- 6.6.4 Crop protection
- 6.6.5 Seed treatment
- 6.7 Sports nutrition & fitness
- 6.7.1 Pre-workout supplement
- 6.7.2 Post-workout recovery
- 6.7.3 Protein powder
- 6.7.4 Energy bar & snack
- 6.7.5 Hydration product
Chapter 7 Market Estimates and Forecast, By Region, 2021-2034 (USD Million) (Kilo Tons)
- 7.1 Key trends
- 7.2 North America
- 7.2.1 U.S.
- 7.2.2 Canada
- 7.3 Europe
- 7.3.1 Germany
- 7.3.2 UK
- 7.3.3 France
- 7.3.4 Spain
- 7.3.5 Italy
- 7.3.6 Rest of Europe
- 7.4 Asia Pacific
- 7.4.1 China
- 7.4.2 India
- 7.4.3 Japan
- 7.4.4 Australia
- 7.4.5 South Korea
- 7.4.6 Rest of Asia Pacific
- 7.5 Latin America
- 7.5.1 Brazil
- 7.5.2 Mexico
- 7.5.3 Argentina
- 7.5.4 Rest of Latin America
- 7.6 Middle East and Africa
- 7.6.1 Saudi Arabia
- 7.6.2 South Africa
- 7.6.3 UAE
- 7.6.4 Rest of Middle East and Africa
Chapter 8 Company Profiles
- 8.1 Arla Foods Ingredients Group
- 8.2 DSM-Firmenich
- 8.3 Fonterra (NZMP)
- 8.4 GELITA
- 8.5 Glanbia plc
- 8.6 Kerry Group plc
- 8.7 Novonesis
- 8.8 PB Leiner
- 8.9 Rousselot
- 8.10 Tessenderlo Group

