
PUBLISHER: Global Market Insights Inc. | PRODUCT CODE: 1892647

PUBLISHER: Global Market Insights Inc. | PRODUCT CODE: 1892647
Circular Economy Chemicals Market Opportunity, Growth Drivers, Industry Trend Analysis, and Forecast 2025 - 2034
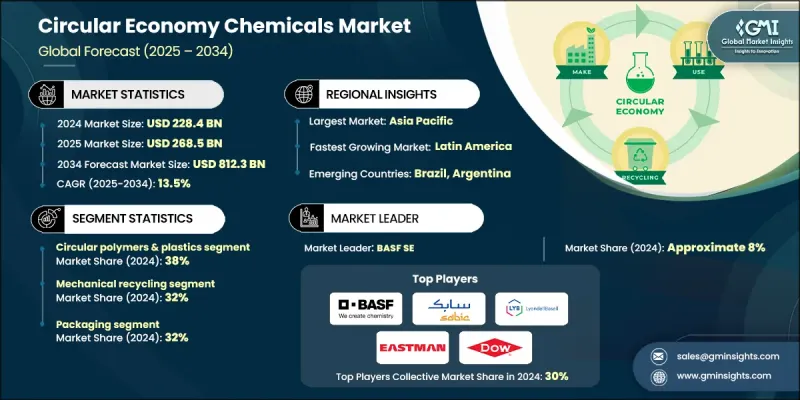
The Global Circular Economy Chemicals Market was valued at USD 228.4 billion in 2024 and is estimated to grow at a CAGR of 13.5% to reach USD 812.3 billion by 2034.
This industry includes polymers, resins, organic and inorganic chemicals, intermediate materials, and specialty chemicals derived from mechanical and chemical recycling, bio-based feedstocks, and industrial waste recovery. Growth in this sector is accelerating as regulatory frameworks evolve, sustainability commitments intensify, and advanced recycling technologies reach greater maturity. Three major shifts are reshaping the landscape: the large-scale development of chemical and advanced recycling plants for difficult waste streams, the adoption of circular business models across major industrial verticals, and the expansion of certification systems and mass balance approaches that allow companies to verify and commercialize circular content. These trends are generating substantial new demand for circular chemicals across packaging, mobility, electronics, and consumer goods. As industries work toward decarbonization and reduced waste, the circular economy chemicals market continues to gain traction as companies explore innovative pathways to close material loops and reduce their dependence on traditional fossil-based feedstocks.
| Market Scope | |
|---|---|
| Start Year | 2024 |
| Forecast Year | 2025-2034 |
| Start Value | $228.4 Billion |
| Forecast Value | $812.3 Billion |
| CAGR | 13.5% |
The circular polymers and plastics segment held a 38% share in 2024 and is expected to grow at a CAGR of 13.5% through 2034. Their dominance stems from the immense global consumption of plastics across packaging, construction, automotive components, electronics, and household products. Rising pressure to reduce plastic waste and improve recycling rates has intensified the need for circular alternatives that can support both environmental and industrial performance requirements.
The mechanical recycling segment accounted for a 32% share in 2024 and is projected to grow at a CAGR of 11.8% between 2025 and 2034. This method maintains its leading position due to its cost-efficiency and practical applicability across post-consumer and post-industrial plastic streams. Its relatively straightforward processing methods make it a widely adopted solution for many end-use industries seeking economical recycling options.
Europe Circular Economy Chemicals Market generated USD 61.7 billion in 2024, reflecting its strong presence in the global circular economy chemicals sector. The region benefits from advanced waste management systems, ambitious policy directives, and extensive recycling infrastructure. Comprehensive initiatives aimed at increasing recycling rates and improving product circularity continue to support the region's leadership as it pushes toward more sustainable chemical production and waste reduction.
Key companies active in the Global Circular Economy Chemicals Market include BASF SE, Borealis AG, Braskem S.A., Carbios SA, Covestro AG, Dow Inc., DSM-Firmenich, Eastman Chemical Company, Evonik Industries AG, INEOS Group, LG Chem Ltd., Loop Industries Inc., LyondellBasell Industries N.V., Mitsubishi Chemical Group Corporation, Mitsui Chemicals, Inc., Neste Oyj, Reliance Industries Limited, SABIC, Solvay S.A., and Veolia Environnement S.A. Companies operating in the Global Circular Economy Chemicals Market are adopting several strategies to reinforce their competitive standing. Many are expanding partnerships with waste management firms to secure stable access to recycled feedstocks and enhance material traceability. Investments in advanced recycling technologies, such as depolymerization and solvent-based recovery, are helping companies improve output quality and broaden application potential. Firms are also scaling bio-based production capacities to diversify beyond fossil-derived inputs.
Table of Contents
Chapter 1 Methodology & Scope
- 1.1 Market scope and definition
- 1.2 Research design
- 1.2.1 Research approach
- 1.2.2 Data collection methods
- 1.3 Data mining sources
- 1.3.1 Global
- 1.3.2 Regional/Country
- 1.4 Base estimates and calculations
- 1.4.1 Base year calculation
- 1.4.2 Key trends for market estimation
- 1.5 Primary research and validation
- 1.5.1 Primary sources
- 1.6 Forecast model
- 1.7 Research assumptions and limitations
Chapter 2 Executive Summary
- 2.1 Industry 3600 synopsis
- 2.2 Key market trends
- 2.2.1 Regional
- 2.2.2 Type
- 2.2.3 Process
- 2.2.4 End Use Industry
- 2.3 TAM Analysis, 2025-2034
- 2.4 CXO perspectives: Strategic imperatives
- 2.4.1 Executive decision points
- 2.4.2 Critical success factors
- 2.5 Future Outlook and Strategic Recommendations
Chapter 3 Industry Insights
- 3.1 Industry ecosystem analysis
- 3.1.1 Supplier landscape
- 3.1.2 Profit margin
- 3.1.3 Value addition at each stage
- 3.1.4 Factor affecting the value chain
- 3.1.5 Disruptions
- 3.2 Industry impact forces
- 3.2.1 Growth drivers
- 3.2.2 Industry pitfalls and challenges
- 3.2.3 Market opportunities
- 3.3 Growth potential analysis
- 3.4 Regulatory landscape
- 3.4.1 North America
- 3.4.2 Europe
- 3.4.3 Asia Pacific
- 3.4.4 Latin America
- 3.4.5 Middle East & Africa
- 3.5 Porter's analysis
- 3.6 PESTEL analysis
- 3.7 Price trends
- 3.7.1 By region
- 3.7.2 By type
- 3.8 Future market trends
- 3.9 Technology and Innovation landscape
- 3.9.1 Current technological trends
- 3.9.2 Emerging technologies
- 3.10 Patent Landscape
- 3.11 Trade statistics (HS code) (Note: the trade statistics will be provided for key countries only)
- 3.11.1 Major importing countries
- 3.11.2 Major exporting countries
- 3.12 Sustainability and environmental aspects
- 3.12.1 Sustainable practices
- 3.12.2 Waste reduction strategies
- 3.12.3 Energy efficiency in production
- 3.12.4 Eco-friendly initiatives
- 3.13 Carbon footprint consideration
Chapter 4 Competitive Landscape, 2024
- 4.1 Introduction
- 4.2 Company market share analysis
- 4.2.1 By region
- 4.2.1.1 North America
- 4.2.1.2 Europe
- 4.2.1.3 Asia Pacific
- 4.2.1.4 LATAM
- 4.2.1.5 MEA
- 4.2.1 By region
- 4.3 Company matrix analysis
- 4.4 Competitive analysis of major market players
- 4.5 Competitive positioning matrix
- 4.6 Key developments
- 4.6.1 Mergers & acquisitions
- 4.6.2 Partnerships & collaborations
- 4.6.3 New Product Launches
- 4.6.4 Expansion Plans
Chapter 5 Market Estimates and Forecast, By Type, 2021-2034 (USD Billion) (Kilo Tons)
- 5.1 Key trends
- 5.2 Circular Polymers & Plastics
- 5.3 Circular Solvents
- 5.4 Recovered Metals & Inorganic Chemicals
- 5.5 Bio-Chemicals
- 5.6 CO2-Based Chemicals
- 5.7 Recovered Specialty Chemicals
Chapter 6 Market Estimates and Forecast, By Process, 2021-2034 (USD Billion) (Kilo Tons)
- 6.1 Key trends
- 6.2 Mechanical Recycling
- 6.3 Chemical Recycling
- 6.4 Biological/Enzymatic Processing
- 6.5 CO2 Capture & Utilization (CCU)
- 6.6 Biorefining
- 6.7 Solvent Recovery & Purification
Chapter 7 Market Estimates and Forecast, By End Use Industry, 2021-2034 (USD Billion) (Kilo Tons)
- 7.1 Key trends
- 7.2 Packaging
- 7.2.1 Flexible Packaging
- 7.2.2 Rigid Packaging
- 7.2.3 Industrial & Transport Packaging
- 7.2.4 Compostable & Biodegradable Packaging
- 7.3 Automotive & Transportation
- 7.3.1 Interior Components
- 7.3.2 Exterior & Structural Components
- 7.3.3 Under-the-Hood & Powertrain
- 7.3.4 Electrical & Electronic Systems
- 7.3.5 Coatings & Surface Protection
- 7.4 Construction & Building Materials
- 7.4.1 Insulation Materials
- 7.4.2 Structural & Finishing Materials
- 7.4.3 Adhesives, Sealants & Coatings
- 7.4.4 Piping & Infrastructure
- 7.5 Textiles & Apparel
- 7.5.1 Fashion & Apparel
- 7.5.2 Home Textiles & Furnishings
- 7.5.3 Technical & Industrial Textiles
- 7.6 Agriculture
- 7.6.1 Agricultural Films
- 7.6.2 Fertilizers & Soil Amendments
- 7.6.3 Crop Protection & Agricultural Chemicals
- 7.6.4 Irrigation & Water Management
- 7.7 Electronics & Electrical
- 7.7.1 Consumer Electronics
- 7.7.2 Industrial Electronics & Equipment
- 7.7.3 Energy Storage & Batteries
- 7.7.4 Wire, Cable & Electrical Infrastructure
- 7.8 Consumer Products & Personal Care
- 7.8.1 Personal Care Products
Chapter 8 Market Estimates and Forecast, By Region, 2021-2034 (USD Billion) (Kilo Tons)
- 8.1 Key trends
- 8.2 North America
- 8.2.1 U.S.
- 8.2.2 Canada
- 8.3 Europe
- 8.3.1 Germany
- 8.3.2 UK
- 8.3.3 France
- 8.3.4 Spain
- 8.3.5 Italy
- 8.3.6 Rest of Europe
- 8.4 Asia Pacific
- 8.4.1 China
- 8.4.2 India
- 8.4.3 Japan
- 8.4.4 Australia
- 8.4.5 South Korea
- 8.4.6 Rest of Asia Pacific
- 8.5 Latin America
- 8.5.1 Brazil
- 8.5.2 Mexico
- 8.5.3 Argentina
- 8.5.4 Rest of Latin America
- 8.6 Middle East and Africa
- 8.6.1 Saudi Arabia
- 8.6.2 South Africa
- 8.6.3 UAE
- 8.6.4 Rest of Middle East and Africa
Chapter 9 Company Profiles
- 9.1 BASF SE
- 9.2 Borealis AG
- 9.3 Braskem S.A.
- 9.4 Carbios SA
- 9.5 Covestro AG
- 9.6 Dow Inc.
- 9.7 DSM-Firmenich
- 9.8 Eastman Chemical Company
- 9.9 Evonik Industries AG
- 9.10 INEOS Group
- 9.11 LG Chem Ltd.
- 9.12 Loop Industries Inc.
- 9.13 LyondellBasell Industries N.V.
- 9.14 Mitsubishi Chemical Group Corporation
- 9.15 Mitsui Chemicals, Inc.
- 9.16 Neste Oyj
- 9.17 Reliance Industries Limited
- 9.18 SABIC
- 9.19 Solvay S.A.
- 9.20 Veolia Environnement S.A.

