
PUBLISHER: Global Market Insights Inc. | PRODUCT CODE: 1892685

PUBLISHER: Global Market Insights Inc. | PRODUCT CODE: 1892685
Trading Card Games Market Opportunity, Growth Drivers, Industry Trend Analysis, and Forecast 2026 - 2035
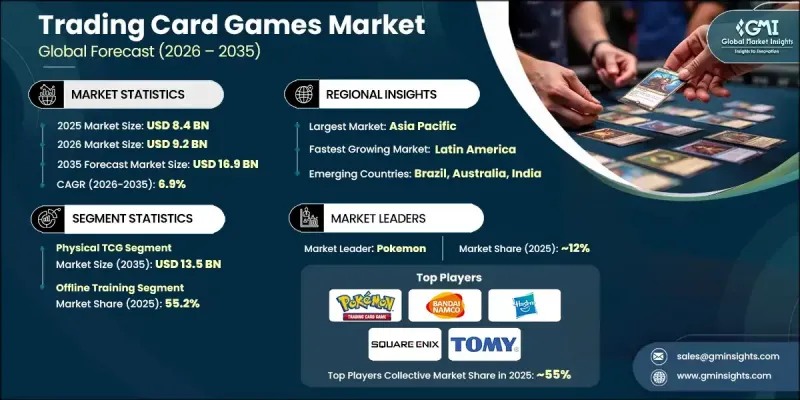
The Global Trading Card Games Market was valued at USD 8.4 billion in 2025 and is estimated to grow at a CAGR of 6.9% to reach USD 16.9 billion by 2035.
The landscape of the TCG industry is undergoing a major transformation as blockchain technology and NFTs introduce new ways to authenticate digital assets and confirm ownership history. Many long-standing trading card brands are developing digital collectible cards that maintain verifiable authenticity, helping bridge the experience of traditional collecting with modern digital engagement. This shift is bringing new opportunities for publishers and appealing to emerging collector communities who value transparency and security in their digital purchases. The expanded role of digital assets is creating new forms of participation, enabling collectors to interact with their favorite franchises across multiple platforms. Collaborative projects between TCG companies and entertainment brands are expanding this momentum, broadening consumer reach, and strengthening fan loyalty. These partnerships help new titles gain immediate recognition and make it easier for publishers to enter a highly competitive market.
| Market Scope | |
|---|---|
| Start Year | 2025 |
| Forecast Year | 2026-2035 |
| Start Value | $8.4 Billion |
| Forecast Value | $16.9 Billion |
| CAGR | 6.9% |
The physical trading card games segment generated USD 7 billion in 2025 and is forecasted to reach USD 13.5 billion by 2035. Physical cards remain deeply valued by collectors who seek tangible items with display appeal and long-term investment potential. The enjoyment of owning and exchanging physical collectibles drives steady demand and contributes to their ability to appreciate in value.
The offline retail segment generated USD 4.6 billion in 2025, representing about 55.2% of the market. Distribution involves hobby shops, mass merchandise retailers, comic stores, convenience outlets, and dedicated gaming venues. Specialty gaming stores play a central role because they support community interaction, facilitate in-person play events, connect players with knowledgeable staff, and provide immediate access to products and an experience that digital platforms cannot fully replicate.
U.S. Trading Card Games Market generated USD 2.2 billion in 2025 and is expected to grow at a CAGR of 8% from 2026 to 2035. The US accounts for nearly 81% of North American TCG revenue, with Canada contributing the remaining 19%. Collectors in the United States remain strongly attached to established franchises, and these titles continue to secure leading positions even as the market welcomes new competitors.
Key companies active in the Trading Card Games Market include Bandai Namco, Bushiroad Inc., Fanatics/Topps, Fantasy Flight, Hasbro, Kayou, Konami, Legend Story Studios, Nintendo Co., Ltd., Panini S.p.A., Pokemon, Ravensburger AG, Square Enix, Tomy Co. Ltd., and Upper Deck Company. Companies in the trading card games market are strengthening their competitive position by expanding cross-media partnerships, enhancing product storytelling, and investing in collectible innovations across physical and digital formats. Many publishers are adopting blockchain-based verification tools to increase consumer trust while developing premium card lines to attract long-term collectors. Firms are also focusing on organized play programs to build community engagement and encourage repeat purchases. Limited-edition releases, diversified licensing agreements, and franchise tie-ins remain central to sustaining brand visibility. To support global demand, companies continue to increase production capacity, streamline distribution networks, and enhance regional market penetration.
Table of Contents
Chapter 1 Methodology & Scope
- 1.1 Market scope and definition
- 1.2 Research design
- 1.2.1 Research approach
- 1.2.2 Data collection methods
- 1.3 Data mining sources
- 1.3.1 Global
- 1.3.2 Regional/Country
- 1.4 Base estimates and calculations
- 1.4.1 Base year calculation
- 1.4.2 Key trends for market estimation
- 1.5 Primary research and validation
- 1.5.1 Primary sources
- 1.6 Forecast model
- 1.7 Research assumptions and limitations
Chapter 2 Executive Summary
- 2.1 Industry 360° synopsis
- 2.2 Key market trends
- 2.2.1 Product type trends
- 2.2.2 Franchise trends
- 2.2.3 Release type trends
- 2.2.4 Price range trends
- 2.2.5 Consumer group trends
- 2.2.6 Distribution channel trends
- 2.3 CXO perspective: Strategic imperatives
- 2.3.1 Key decision points for industry executives
- 2.3.2 Critical success factors for market players
- 2.4 Future outlook and strategic recommendations
- 2.5 Strategic recommendations
- 2.5.1 Supply chain diversification strategy
- 2.5.2 Product portfolio enhancement
- 2.5.3 Partnership and alliance opportunities
- 2.5.4 Cost management and pricing strategy
- 2.6 Decision framework
- 2.6.1 Investment priority matrix
- 2.6.2 ROI analysis
Chapter 3 Industry Insights
- 3.1 Industry ecosystem analysis
- 3.1.1 Publisher Landscape
- 3.1.2 Profit Margin
- 3.1.3 Value addition at each stage
- 3.1.4 Factor affecting the value chain
- 3.2 Industry impact forces
- 3.2.1 Growth drivers
- 3.2.2 Industry pitfalls & challenges
- 3.2.3 Opportunities
- 3.3 Growth potential analysis
- 3.4 Future market trends
- 3.5 Regulatory framework
- 3.5.1 By region
- 3.6 Porter's five forces analysis
- 3.7 PESTEL analysis
Chapter 4 Competitive Landscape, 2025
- 4.1 Introduction
- 4.2 Company market share analysis
- 4.2.1 By Region
- 4.3 Company matrix analysis
- 4.4 Competitive analysis of major market players
- 4.5 Competitive positioning matrix
- 4.6 Product portfolio benchmarking
- 4.7 Key developments
- 4.7.1 Mergers & acquisitions
- 4.7.2 Partnerships & collaborations
- 4.7.3 New Product Launches
- 4.7.4 Expansion Plans
Chapter 5 Market Estimates & Forecast, By Product Type 2022 - 2035 (USD Billion) (Million Cards)
- 5.1 Key trends
- 5.2 Physical TCG
- 5.2.1 Booster Packs
- 5.2.2 Booster Boxes
- 5.2.3 Starter Decks
- 5.2.4 Collector/Premium Products
- 5.2.5 Tins & Blister Packs
- 5.3 Digital TCG
Chapter 6 Market Estimates & Forecast, By Franchise, 2022 - 2035 (USD Billion) (Million Cards)
- 6.1 Key trends
- 6.2 Pokemon
- 6.3 Magic: The Gathering
- 6.4 Yu-Gi-Oh!
- 6.5 Anime/Manga TCGs
- 6.6 Star Wars
- 6.7 Others (Vanguard, etc.)
Chapter 7 Market Estimates & Forecast, By Release Type, 2022 - 2035 (USD Billion) (Million Cards)
- 7.1 Key trends
- 7.2 Standard Sets
- 7.3 Special/Limited Editions
- 7.4 Promotional Products
- 7.5 Reprints/Reissues
Chapter 8 Market Estimates & Forecast, By Price Range, 2022 - 2035 (USD Billion) (Million Cards)
- 8.1 Key trends
- 8.2 Economy (USD 3- USD 15)
- 8.3 Mid-Tier (USD 15 - USD 50)
- 8.4 Premium (USD 50 - USD 150)
- 8.5 Ultra-Premium (Above USD 150)
Chapter 9 Market Estimates & Forecast, By Consumer Group, 2022 - 2035 (USD Billion) (Million Cards)
- 9.1 Key trends
- 9.2 Players/Gamers
- 9.3 Investors/Collector
- 9.4 Children/Families
Chapter 10 Market Estimates & Forecast, By Distribution Channel, 2022 - 2035, (USD Billion) (Million Cards)
- 10.1 Key trends
- 10.2 Online
- 10.2.1 E-commerce website
- 10.2.2 Company owned website
- 10.3 Offline
- 10.3.1 Mass Retail Stores
- 10.3.2 Specialty Stores
- 10.3.3 Others
Chapter 11 Market Estimates & Forecast, By Region, 2022 - 2035, (USD Billion) (Million Cards)
- 11.1 Key trends
- 11.2 North America
- 11.2.1 U.S.
- 11.2.2 Canada
- 11.3 Europe
- 11.3.1 Germany
- 11.3.2 U.K.
- 11.3.3 France
- 11.3.4 Italy
- 11.3.5 Spain
- 11.4 Asia Pacific
- 11.4.1 China
- 11.4.2 India
- 11.4.3 Japan
- 11.4.4 South Korea
- 11.4.5 Australia
- 11.5 Latin America
- 11.5.1 Brazil
- 11.5.2 Mexico
- 11.5.3 Argentina
- 11.6 MEA
- 11.6.1 UAE
- 11.6.2 Saudi Arabia
- 11.6.3 South Africa
Chapter 12 Company Profiles (Business Overview, Financial Data, Product Landscape, Strategic Outlook, SWOT Analysis)
- 12.1 Bandai Namco
- 12.2 Bushiroad Inc.
- 12.3 Fanatics/Topps
- 12.4 Fantasy Flight
- 12.5 Hasbro
- 12.6 Kayou
- 12.7 Konami
- 12.8 Legend Story Studios
- 12.9 Nintendo Co., Ltd.
- 12.10 Panini S.p.A.
- 12.11 Pokemon
- 12.12 Ravensburger AG
- 12.13 Square Enix
- 12.14 Tomy Co. Ltd.
- 12.15 Upper Deck Company

