
PUBLISHER: Global Market Insights Inc. | PRODUCT CODE: 1892697

PUBLISHER: Global Market Insights Inc. | PRODUCT CODE: 1892697
Demand-Responsive Transit Systems Market Opportunity, Growth Drivers, Industry Trend Analysis, and Forecast 2025 - 2034
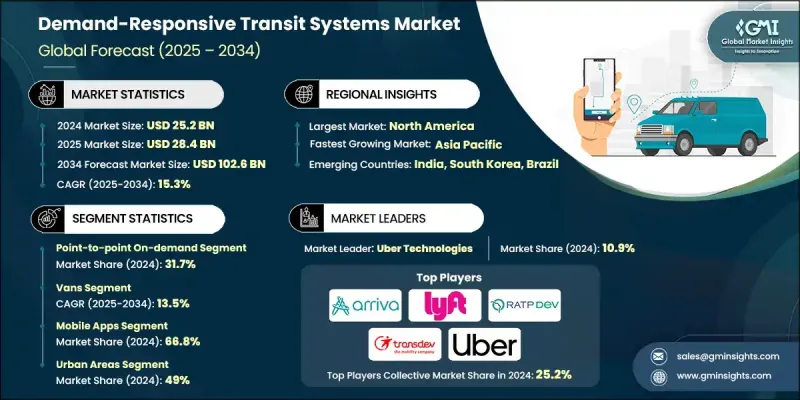
The Global Demand-Responsive Transit Systems Market was valued at USD 25.2 billion in 2024 and is estimated to grow at a CAGR of 15.3% to reach USD 102.6 billion by 2034.
Demand-responsive transit is expanding as regions adopt flexible mobility services capable of adapting to varying passenger volumes and filling gaps where public transportation remains limited. Government involvement continues to strengthen as agencies recognize the efficiency gains of dynamic transportation models, with operational assessments consistently demonstrating improvements in resource use and trip management. The adoption of advanced technology is now central to market growth, as real-time dispatching tools, mobile booking platforms, and intelligent routing software allow operators to manage pooled trips more effectively and reduce unnecessary miles traveled. These systems also increase reliability without requiring fleets to expand, creating a more efficient and scalable service model for both urban and rural applications. As digital integration reshapes the transit ecosystem, demand-responsive networks are becoming a critical component in modern transportation planning across multiple regions.
| Market Scope | |
|---|---|
| Start Year | 2024 |
| Forecast Year | 2025-2034 |
| Start Value | $25.2 Billion |
| Forecast Value | $102.6 Billion |
| CAGR | 15.3% |
The point-to-point on-demand segment held a 31.7% share in 2024. This segment leads because passengers increasingly value flexible, direct travel solutions that minimize wait times and provide tailored routing. Service providers benefit through higher vehicle utilization and lower operating costs, which support more sustainable service models.
The vans segment dominated in 2024 and is forecast to grow at 13.5% CAGR from 2025 to 2034. Vans remain the preferred vehicle type due to their adaptability, suitable passenger capacity, and affordability. Their ability to navigate both narrow roads and moderate-demand corridors makes them popular for operators looking to match route needs with optimized cost structures. In areas requiring greater passenger volume management, cutaway buses continue to complement van-based deployments.
US Demand-Responsive Transit Systems Market accounted for 80.7% share and generated USD 7.3 billion in 2024. Demand-responsive transit has gained traction across rural and lower-density regions, where it provides an economical mobility solution and enhances transportation equity. In multiple analyses, replacing fixed-route services with dynamic systems has demonstrated significant reductions in per-trip costs and notable increases in ridership, reinforcing the operational advantages of flexible models.
Major companies in the Demand-Responsive Transit Systems Market include Arriva, Go-Ahead, Keolis, Lyft, Moovit, Padam Mobility, RATP Dev, Transdev, Uber Technologies, and Via Transportation. Companies in the Demand-Responsive Transit Systems Market are strengthening their market position by expanding digital platforms, enhancing real-time routing algorithms, and investing in integrated mobility solutions that connect multiple transportation modes. Many organizations are partnering with municipalities and transit agencies to deploy turnkey systems that streamline booking, dispatch, and fleet coordination. Strategic emphasis is placed on lowering operational costs through advanced data analytics, which improves load balancing and reduces unnecessary mileage. Firms are also creating modular service models tailored to suburban, urban, and rural environments to broaden their customer base.
Table of Contents
Chapter 1 Methodology
- 1.1 Market scope and definition
- 1.2 Research design
- 1.2.1 Research approach
- 1.2.2 Data collection methods
- 1.3 Data mining sources
- 1.3.1 Global
- 1.3.2 Regional/Country
- 1.4 Base estimates and calculations
- 1.4.1 Base year calculation
- 1.4.2 Key trends for market estimation
- 1.5 Primary research and validation
- 1.5.1 Primary sources
- 1.6 Forecast
- 1.7 Research assumptions and limitations
Chapter 2 Executive Summary
- 2.1 Industry 360° synopsis, 2021 - 2034
- 2.2 Key market trends
- 2.2.1 Regional
- 2.2.2 Service
- 2.2.3 Vehicle
- 2.2.4 Technology
- 2.2.5 Application
- 2.3 TAM Analysis, 2025-2034
- 2.4 CXO perspectives: Strategic imperatives
- 2.4.1 Executive decision points
- 2.4.2 Critical success factors
- 2.5 Future outlook and strategic recommendations
Chapter 3 Industry Insights
- 3.1 Industry ecosystem analysis
- 3.1.1 Supplier landscape
- 3.1.2 Profit margin analysis
- 3.1.3 Cost structure
- 3.1.4 Value addition at each stage
- 3.1.5 Factor affecting the value chain
- 3.1.6 Disruptions
- 3.2 Industry impact forces
- 3.2.1 Growth drivers
- 3.2.1.1 Growing urbanization and micro-mobility demand
- 3.2.1.2 Advances in real-time routing, dynamic dispatch & mobile apps
- 3.2.1.3 Policy push towards reducing congestion & emissions
- 3.2.1.4 Rising demand for paratransit and first/last-mile solutions
- 3.2.2 Industry pitfalls and challenges
- 3.2.2.1 Variable regulatory frameworks across cities
- 3.2.2.2 Public transit incumbents’ resistance & funding limits
- 3.2.3 Market opportunities
- 3.2.3.1 Integration with MaaS platforms and transit agencies
- 3.2.3.2 Electrification and micro-transit (EV shuttles, e-bikes/scooters)
- 3.2.1 Growth drivers
- 3.3 Growth potential analysis
- 3.4 Regulatory landscape
- 3.4.1 North America
- 3.4.2 Europe
- 3.4.3 Asia Pacific
- 3.4.4 Latin America
- 3.4.5 Middle East & Africa
- 3.5 Porter's analysis
- 3.6 Pestel analysis
- 3.7 Technology and innovation landscape
- 3.7.1 Current technological trends
- 3.7.2 Emerging technologies
- 3.8 Pricing analysis
- 3.8.1 Software-as-a-service (SaaS) pricing models
- 3.8.2 Per-trip and per-ride pricing structures
- 3.8.3 Turnkey solution pricing
- 3.8.4 Total cost of ownership analysis
- 3.9 Cost breakdown analysis
- 3.10 Patent & intellectual property analysis
- 3.10.1 Dynamic routing algorithm patents
- 3.10.2 Demand prediction and matching technology patents
- 3.10.3 Accessibility technology patents
- 3.11 Sustainability and environmental aspects
- 3.11.1 Sustainable practices
- 3.11.2 Waste reduction strategies
- 3.11.3 Energy efficiency in production
- 3.11.4 Eco-friendly Initiatives
- 3.11.5 Carbon footprint considerations
- 3.12 Use cases
- 3.13 Best-case scenario
- 3.14 Investment & funding analysis
- 3.14.1 Venture capital and private equity investments
- 3.14.2 Government grants and subsidies (FTA section 5310, 5311)
- 3.14.3 Public-private partnership models
- 3.15 User adoption barriers & digital divide assessment
- 3.15.1 Technology literacy and demographic challenges
- 3.15.2 Smartphone penetration and device accessibility
- 3.15.3 Multi-channel booking requirements (app, web, IVR, SMS, call center)
- 3.15.4 Language and cultural barriers
- 3.15.5 Trust and privacy concerns
- 3.15.6 Strategies for inclusive service design
- 3.16 Operational cost structure & economics by service model
- 3.16.1 Paratransit cost per trip analysis
- 3.16.2 Microtransit cost per passenger mile
- 3.16.3 Fixed-route vs. demand-responsive cost comparison
- 3.16.4 Labor cost components (driver, dispatch, call center)
- 3.16.5 Technology and software licensing costs
- 3.16.6 Vehicle acquisition and maintenance costs
- 3.16.7 Fuel and energy costs (ICE vs. EV)
- 3.16.8 Administrative and overhead allocation
- 3.16.9 Subsidy requirements and farebox recovery ratios
Chapter 4 Competitive Landscape, 2024
- 4.1 Introduction
- 4.2 Company market share analysis
- 4.2.1 North America
- 4.2.2 Europe
- 4.2.3 Asia Pacific
- 4.2.4 LATAM
- 4.2.5 MEA
- 4.3 Competitive analysis of major market players
- 4.4 Competitive positioning matrix
- 4.5 Strategic outlook matrix
- 4.6 Key developments
- 4.6.1 Mergers & acquisitions
- 4.6.2 Partnerships & collaborations
- 4.6.3 New product launches
- 4.6.4 Expansion plans and funding
Chapter 5 Market Estimates & Forecast, By Services, 2021 - 2034 ($Mn)
- 5.1 Key trends
- 5.2 Paratransit
- 5.3 Microtransit
- 5.4 Dial-a-Ride
- 5.5 Route Deviation Services
- 5.6 Point-to-Point On-Demand
- 5.7 Subscription-Based Services
- 5.8 Others
Chapter 6 Market Estimates & Forecast, By Vehicle, 2021 - 2034 ($Mn)
- 6.1 Key trends
- 6.2 Vans
- 6.3 Cutaway Buses
- 6.4 Minibuses
- 6.5 Sedans & Cars
- 6.6 Electric Vehicles (EVs)
- 6.7 Autonomous Vehicles (AVs)
Chapter 7 Market Estimates & Forecast, By Technology, 2021 - 2034 ($Mn)
- 7.1 Key trends
- 7.2 Traditional booking system
- 7.3 Mobile apps
- 7.4 Others
Chapter 8 Market Estimates & Forecast, By Application, 2021 - 2034 ($Mn)
- 8.1 Key trends
- 8.2 Urban areas
- 8.3 Rural areas
- 8.4 Corporate
- 8.5 Public sector
- 8.6 Others
Chapter 9 Market Estimates & Forecast, By Region, 2021 - 2034 ($Mn)
- 9.1 Key trends
- 9.2 North America
- 9.2.1 US
- 9.2.2 Canada
- 9.3 Europe
- 9.3.1 Germany
- 9.3.2 UK
- 9.3.3 France
- 9.3.4 Italy
- 9.3.5 Spain
- 9.3.6 Nordics
- 9.3.7 Russia
- 9.4 Asia Pacific
- 9.4.1 China
- 9.4.2 India
- 9.4.3 Japan
- 9.4.4 Australia
- 9.4.5 South Korea
- 9.4.6 Singapore
- 9.4.7 Malaysia
- 9.4.8 Thailand
- 9.5 Latin America
- 9.5.1 Brazil
- 9.5.2 Mexico
- 9.5.3 Argentina
- 9.6 MEA
- 9.6.1 South Africa
- 9.6.2 Saudi Arabia
- 9.6.3 UAE
Chapter 10 Company Profiles
- 10.1 Global Players
- 10.1.1 Ecolane
- 10.1.2 Lyft
- 10.1.3 Masabi
- 10.1.4 Moovit
- 10.1.5 Optibus
- 10.1.6 Spare Labs
- 10.1.7 TransLoc
- 10.1.8 Trapeze
- 10.1.9 Uber Technologies
- 10.1.10 Via Transportation
- 10.2 Regional Players
- 10.2.1 Arriva
- 10.2.2 Go-Ahead
- 10.2.3 Keolis
- 10.2.4 Padam Mobility
- 10.2.5 RATP Dev
- 10.2.6 Transdev
- 10.3 Emerging & Niche Players
- 10.3.1 Clever Devices
- 10.3.2 Remix
- 10.3.3 Routematch
- 10.3.4 TripSpark Technologies

