
PUBLISHER: Global Market Insights Inc. | PRODUCT CODE: 1892803

PUBLISHER: Global Market Insights Inc. | PRODUCT CODE: 1892803
Electric Vehicle (EV) Taxi Market Opportunity, Growth Drivers, Industry Trend Analysis, and Forecast 2026 - 2035
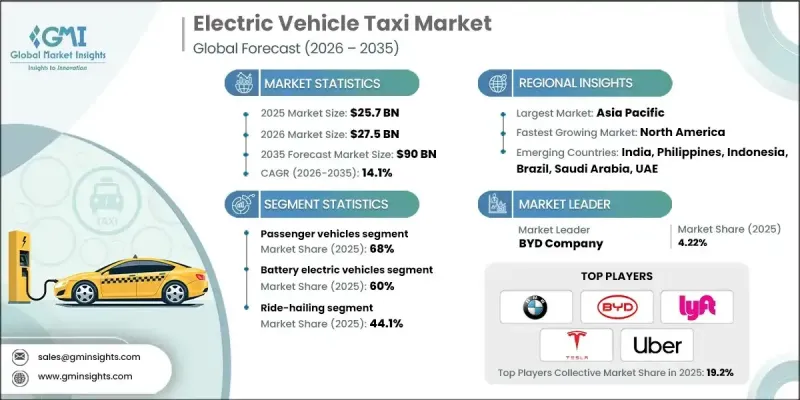
The Global Electric Vehicle Taxi Market was valued at USD 25.7 billion in 2025 and is estimated to grow at a CAGR of 14.1% to reach USD 90 billion by 2035.
Growth is fueled by the global shift toward sustainable transportation, intelligent fleet management, and electrified urban mobility systems. Modern EV taxi platforms combine high-capacity batteries, AI-driven fleet optimization, real-time vehicle monitoring, and smart charging networks to enhance efficiency, reduce operating costs, minimize emissions, and elevate passenger safety. Governments and mobility service providers are increasingly transitioning to electric taxis to meet regulatory mandates, reduce fuel dependency, and improve city-wide transport sustainability. These innovations also help operators anticipate maintenance needs, avoid fuel price volatility, and optimize route planning. Industry consolidation, strategic alliances, and technology partnerships are reshaping the EV taxi landscape, with manufacturers, battery suppliers, and software providers working together to develop long-range vehicles, ultra-fast charging solutions, and integrated digital platforms that ensure seamless operations and energy-efficient routing.
| Market Scope | |
|---|---|
| Start Year | 2025 |
| Forecast Year | 2026-2035 |
| Start Value | $25.7 Billion |
| Forecast Value | $90 Billion |
| CAGR | 14.1% |
The passenger vehicle segment held a 68% share in 2025 and is expected to grow at a CAGR of 13.6% through 2035. Compact and mid-sized cars dominate the EV taxi industry due to their affordability, efficient energy consumption, and suitability for daily urban routes. Their compatibility with EV powertrains allows fleet operators to leverage subsidies, reduce fuel expenses, and lower emissions while simplifying maintenance.
The battery electric vehicles segment held a 60% share in 2025 and is projected to grow at a CAGR of 14.4% by 2035. BEVs are preferred for taxi operations due to zero-emission operation, lower running costs, longer ranges, faster charging, and superior safety features. Government incentives and expanding public and private charging networks further drive adoption, ensuring continuous operations and increased fleet efficiency.
China Electric Vehicle Taxi Market held a 37% share, generating USD 4.02 billion in 2024. Rapid fleet electrification, strong government incentives, and aggressive emission-reduction policies are accelerating adoption, especially in major urban centers. Subsidies, reduced licensing fees, and preferential charging programs encourage taxi operators to transition from traditional ICE vehicles to EVs.
Prominent companies operating in the Electric Vehicle Taxi Market include Tesla, BYD Company, Uber Electric, Didi Chuxing, OLA, BMW, BAIC, EV Capital, EVERA Auto, and Lyft. Companies are strengthening their Electric Vehicle Taxi Market positions by developing long-range EV taxis and integrating solid-state or high-density battery systems to enhance vehicle performance and reliability. Strategic partnerships with charging network providers, fleet management software companies, and urban mobility platforms enable seamless operations, optimized routing, and energy-efficient trip allocation. Leading players are investing in AI-driven fleet optimization, predictive maintenance tools, and real-time telematics to reduce downtime and operating costs. Incentive programs, fleet subscription models, and flexible leasing solutions help attract taxi operators to EV adoption.
Table of Contents
Chapter 1 Methodology
- 1.1 Market scope and definition
- 1.2 Research design
- 1.2.1 Research approach
- 1.2.2 Data collection methods
- 1.3 Data mining sources
- 1.3.1 Global
- 1.3.2 Regional/Country
- 1.4 Base estimates and calculations
- 1.4.1 Base year calculation
- 1.4.2 Key trends for market estimation
- 1.5 Primary research and validation
- 1.5.1 Primary sources
- 1.6 Forecast model
- 1.7 Research assumptions and limitations
Chapter 2 Executive Summary
- 2.1 Industry 3600 synopsis, 2022 - 2035
- 2.2 Key market trends
- 2.2.1 Regional
- 2.2.2 Vehicle
- 2.2.3 Propulsion
- 2.2.4 Service
- 2.2.5 Ownership Model
- 2.2.6 Range
- 2.2.7 Charging Infrastructure
- 2.3 TAM Analysis, 2026-2035
- 2.4 CXO perspectives: Strategic imperatives
- 2.4.1 Executive decision points
- 2.4.2 Critical success factors
- 2.5 Future outlook and strategic recommendations
Chapter 3 Industry Insights
- 3.1 Industry ecosystem analysis
- 3.1.1 Supplier landscape
- 3.1.2 Profit margin analysis
- 3.1.3 Cost structure
- 3.1.4 Value addition at each stage
- 3.1.5 Factor affecting the value chain
- 3.1.6 Disruptions
- 3.2 Industry impact forces
- 3.2.1 Growth drivers
- 3.2.1.1 Government incentives and stricter emission norms
- 3.2.1.2 Rising fuel prices of gasoline-powered vehicles
- 3.2.1.3 Advancements in battery technology
- 3.2.1.4 Growing awareness about climate change and the need for sustainable transportation solutions
- 3.2.1.5 Rapid urbanization and smart city initiatives
- 3.2.2 Industry pitfalls and challenges
- 3.2.2.1 High initial costs of electric vehicles
- 3.2.2.2 Limited charging infrastructure
- 3.2.3 Market opportunities
- 3.2.3.1 Expansion of charging infrastructure
- 3.2.3.2 Integration with smart city initiatives
- 3.2.3.3 Fleet electrification programs by corporations
- 3.2.3.4 Technological advancements in batteries and EV components
- 3.2.1 Growth drivers
- 3.3 Growth potential analysis
- 3.4 Regulatory landscape
- 3.4.1 North America
- 3.4.1.1 US Federal incentives (tax credits, grants) plus infrastructure funding (NEVI/IIJA) support fleet electrification and depot charging.
- 3.4.2 Europe
- 3.4.2.1 Germany: Electric Mobility Act (EmoG)
- 3.4.2.2 UK: Plug-in Taxi Grant Scheme (PiTG)
- 3.4.2.3 France: Mobility Orientation Law (LOM Act)
- 3.4.2.4 Italy: National Integrated Plan for Energy and Climate (PNIEC)
- 3.4.3 Asia Pacific
- 3.4.3.1 China: New Energy Vehicle (NEV) Mandate
- 3.4.3.2 India: FAME II Scheme (EV Incentives)
- 3.4.3.3 Japan: Strategic Roadmap for EV/FCV Deployment
- 3.4.3.4 Australia: State-Level Zero-Emission Vehicle Mandates
- 3.4.4 Latin America
- 3.4.4.1 Brazil: National Electric Mobility Policy (PNME)
- 3.4.4.2 Mexico: Urban Zero-Emission Taxi Programs
- 3.4.4.3 Argentina: Provincial EV Taxi Regulations (Buenos Aires)
- 3.4.5 MEA
- 3.4.5.1 UAE: EV Charging Infrastructure Regulation (ADDM/DEWA)
- 3.4.5.2 Saudi Arabia: EV Deployment Regulatory Framework (SASO)
- 3.4.5.3 South Africa: Green Transport Strategy
- 3.4.1 North America
- 3.5 Porter's analysis
- 3.6 PESTEL analysis
- 3.7 Technology and Innovation landscape
- 3.7.1 Current technological trends
- 3.7.2 Emerging technologies
- 3.8 Patent analysis
- 3.9 Pricing Analysis
- 3.9.1 By region
- 3.9.2 By propulsion
- 3.10 Cost breakdown analysis
- 3.10.1 Vehicle Cost
- 3.10.2 Operational Cost
- 3.10.3 Total cost of ownership (TCO)
- 3.10.4 Charging Infrastructure Cost
- 3.10.5 Installation & activation costs
- 3.10.6 Research & development costs
- 3.11 Sustainability and environmental impact analysis
- 3.11.1 Sustainable practices
- 3.11.2 Waste reduction strategies
- 3.11.3 Energy efficiency in production
- 3.11.4 Eco-friendly initiatives
- 3.11.5 Carbon footprint considerations
- 3.12 Future outlook & opportunities
- 3.12.1 Technology roadmap & evolution timeline
- 3.12.2 Emerging application opportunities
- 3.12.3 Investment requirements & funding sources
- 3.12.4 Risk assessment & mitigation strategies
- 3.12.5 Strategic recommendations for market participants
Chapter 4 Competitive Landscape, 2025
- 4.1 Introduction
- 4.2 Company market share analysis
- 4.2.1 North America
- 4.2.2 Europe
- 4.2.3 Asia Pacific
- 4.2.4 Latin America
- 4.2.5 MEA
- 4.3 Competitive analysis of major market players
- 4.4 Competitive positioning matrix
- 4.5 Strategic outlook matrix
- 4.6 Key developments
- 4.6.1 Mergers & acquisitions
- 4.6.2 Partnerships & collaborations
- 4.6.3 New Product Launches
- 4.6.4 Expansion Plans and funding
Chapter 5 Market Estimates & Forecast, By Vehicle, 2022 - 2035 ($Bn, Units)
- 5.1 Key trends
- 5.2 Passenger vehicles
- 5.2.1 Hatchbacks
- 5.2.2 Sedans
- 5.2.3 SUV
- 5.3 Commercial vehicles
- 5.3.1 Light commercial vehicles (LCV)
- 5.3.2 Medium commercial vehicles (MCV)
- 5.3.3 Heavy commercial vehicles (HCV)
Chapter 6 Market Estimates & Forecast, By Propulsion, 2022 - 2035 ($Bn, Units)
- 6.1 Key trends
- 6.2 Battery electric vehicles (BEVs)
- 6.3 Hybrid electric vehicles (HEVs)
- 6.4 Plug-in hybrid electric vehicles (PHEVs)
Chapter 7 Market Estimates & Forecast, By Service, 2022 - 2035 ($Bn, Units)
- 7.1 Key trends
- 7.2 Ride-Hailing
- 7.3 Cab Services
- 7.4 Fleet Operator Services
- 7.5 Robotaxi Services
Chapter 8 Market Estimates & Forecast, By Ownership Model, 2022 - 2035 ($Bn, Units)
- 8.1 Key trends
- 8.2 Fleet-Owned
- 8.3 Individual Driver-Owned
- 8.4 Subscription
- 8.5 Cooperative Models
- 8.6 Others
Chapter 9 Market Estimates & Forecast, By Range, 2022 - 2035 ($Bn, Units)
- 9.1 Key trends
- 9.2 Short Range (<150 km per charge)
- 9.3 Medium Range (150-250 km per charge)
- 9.4 Long Range (250+ km per charge)
Chapter 10 Market Estimates & Forecast, By Charging infrastructure, 2022 - 2035 ($Bn, Units)
- 10.1 Key trends
- 10.2 Fast charging
- 10.3 Slow charging
- 10.4 Wireless charging
Chapter 11 Market Estimates & Forecast, By Region, 2022 - 2035 ($Bn, Units)
- 11.1 Key trends
- 11.2 North America
- 11.2.1 US
- 11.2.2 Canada
- 11.3 Europe
- 11.3.1 Germany
- 11.3.2 UK
- 11.3.3 France
- 11.3.4 Italy
- 11.3.5 Spain
- 11.3.6 Russia
- 11.3.7 Nordics
- 11.4 Asia Pacific
- 11.4.1 China
- 11.4.2 India
- 11.4.3 Japan
- 11.4.4 Australia
- 11.4.5 South Korea
- 11.4.6 Philippines
- 11.4.7 Indonesia
- 11.5 Latin America
- 11.5.1 Brazil
- 11.5.2 Mexico
- 11.5.3 Argentina
- 11.6 MEA
- 11.6.1 South Africa
- 11.6.2 Saudi Arabia
- 11.6.3 UAE
Chapter 12 Company Profiles
- 12.1 Global Players
- 12.1.1 BAIC
- 12.1.2 BYD
- 12.1.3 Didi Chuxing
- 12.1.4 GoGreen Cab Services
- 12.1.5 Green Cab
- 12.1.6 Lyft
- 12.1.7 Nissan Motor
- 12.1.8 Tesla
- 12.1.9 Uber
- 12.1.10 Volkswagen
- 12.1.11 Waymo (Alphabet)
- 12.2 Regional Players
- 12.2.1 Alto
- 12.2.2 BluSmart Mobility
- 12.2.3 EEE-Taxi Mobility Solutions
- 12.2.4 EV Capital
- 12.2.5 EVERA Auto
- 12.2.6 Grab Holdings
- 12.2.7 Ola
- 12.3 Emerging Players
- 12.3.1 Cruise LLC (General Motors)
- 12.3.2 Evera Cabs
- 12.3.3 GSM Green and Smart Mobility
- 12.3.4 Xanh SM

