
PUBLISHER: Global Market Insights Inc. | PRODUCT CODE: 1892837

PUBLISHER: Global Market Insights Inc. | PRODUCT CODE: 1892837
Silicon Photonics Market Opportunity, Growth Drivers, Industry Trend Analysis, and Forecast 2026 - 2035
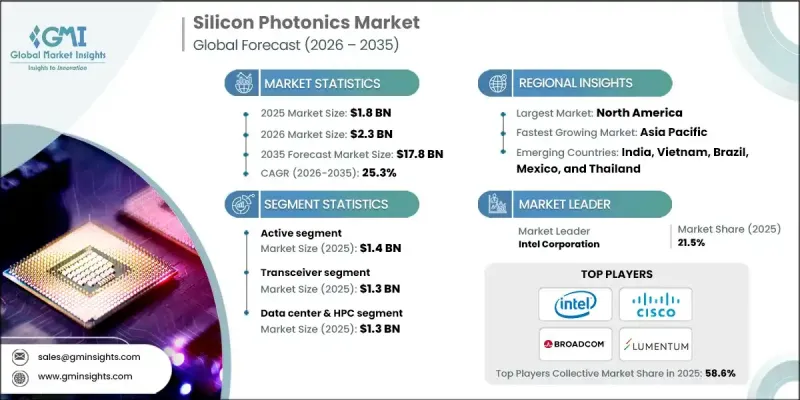
The Global Silicon Photonics Market was valued at USD 1.8 billion in 2025 and is estimated to grow at a CAGR of 25.3% to reach USD 17.8 billion by 2035.
The rapid growth of hyperscale data centers to accommodate increasing cloud workloads is driving the demand for high-bandwidth, energy-efficient optical links. Silicon photonics provides lower latency, higher power efficiency, and reduced energy consumption compared to traditional copper interconnects, which is critical for data-intensive operations in multi-gigawatt data centers and multi-gig server environments. AI and machine learning workloads require massive parallel processing and extremely high data-transfer rates between GPUs, making optical silicon interfaces essential for low-latency, high-speed interconnections. Telecom operators worldwide are upgrading transport, metro, and fronthaul networks to handle escalating 5G traffic and prepare for early 6G deployment, positioning silicon photonics as a cost-effective solution for scaling network bandwidth while optimizing power consumption. The market is being further propelled by the need for compact, energy-efficient optical interconnects that support next-generation supercomputers, smart networking, and advanced communication infrastructures.
| Market Scope | |
|---|---|
| Start Year | 2025 |
| Forecast Year | 2026-2035 |
| Start Value | $1.8 Billion |
| Forecast Value | $17.8 billion |
| CAGR | 25.3% |
The active segment reached USD 1.4 billion in 2025. Its growth is fueled by expanding fiber backbones and 5G infrastructure deployments, which require high-speed, low-latency optical interconnects and switching. Manufacturers are focusing on optimizing active modules for modulators and photodetectors to support cost-effective data center and 5G backhaul applications while integrating seamlessly into existing fiber networks.
The sensor segment is projected to grow at a CAGR of 33.4% during 2026-2035. Adoption is being driven by non-communication applications such as healthcare diagnostics and automotive LiDAR, as well as IoT, smart mobility, and smart-health initiatives that demand compact, highly sensitive optical sensors.
Canada Silicon Photonics Market is expected to grow at a CAGR of 12.4% by 2035. With over 239 operational data centers as of 2024 and several new facilities under development, Canada's favorable climate and access to low-cost renewable energy, including hydro, position the country as a strategic hub for data center expansion and high-speed optical interconnect adoption.
Leading companies in the Global Silicon Photonics Market include Intel, Cisco, Ciena, Broadcom, Hamamatsu, Juniper, STMicroelectronics, Acacia, Finisar, Global Foundries, IBM, Lumentum, Luxtera, Mellanox, Neophotonics, Oclaro, Ranovus, Reflex Photonics, Rockley Photonics, and Sicoya. Key strategies adopted by companies in the Global Silicon Photonics Market include investing in research and development to enhance optical performance, energy efficiency, and miniaturization. Firms are forming strategic partnerships with cloud service providers, data center operators, and telecom companies to accelerate adoption. Expanding regional presence and targeting emerging markets allow companies to capture new growth opportunities. Additionally, they are focusing on integrated solutions that combine active and passive components for cost-effective deployment.
Table of Contents
Chapter 1 Methodology & Scope
- 1.1 Market scope and definition
- 1.2 Research design
- 1.2.1 Research approach
- 1.2.2 Data collection methods
- 1.3 Data mining sources
- 1.3.1 Global
- 1.3.2 Regional/Country
- 1.4 Base estimates and calculations
- 1.4.1 Base year calculation
- 1.4.2 Key trends for market estimation
- 1.5 Primary research and validation
- 1.5.1 Primary sources
- 1.6 Forecast model
- 1.7 Research assumptions and limitations
Chapter 2 Executive Summary
- 2.1 Industry 360° synopsis
- 2.2 Key market trends
- 2.2.1 Product trends
- 2.2.2 Component trends
- 2.2.3 Application trends
- 2.2.4 Regional trends
- 2.3 TAM Analysis, 2026-2035 (USD Million)
- 2.4 CXO perspectives: Strategic imperatives
- 2.4.1 Executive decision points
- 2.4.2 Critical Success Factors
- 2.5 Future Outlook and Strategic Recommendations
Chapter 3 Industry Insights
- 3.1 Industry ecosystem analysis
- 3.1.1 Factor affecting the value chain
- 3.1.2 Profit margin analysis
- 3.1.3 Disruptions
- 3.1.4 Future outlook
- 3.1.5 Manufacturers
- 3.1.6 Distributors
- 3.2 Impact forces
- 3.2.1 Growth drivers
- 3.2.1.1 Rising data center demands
- 3.2.1.2 Explosive AI/ML Workload Growth and GPU Cluster Expansion
- 3.2.1.3 Telecom Upgrades to 5G Advanced and Early 6G Development
- 3.2.1.4 Increasing adoption in consumer electronics
- 3.2.1.5 Emerging Demand from Automotive and Industrial LiDAR
- 3.2.2 Industry pitfalls & challenges
- 3.2.2.1 Integration of On-Chip Lasers and Yield Management
- 3.2.2.2 High development and production costs
- 3.2.1 Growth drivers
- 3.3 Growth potential analysis
- 3.4 Regulatory landscape
- 3.4.1 North America
- 3.4.2 Europe
- 3.4.3 Asia Pacific
- 3.4.4 Latin America
- 3.4.5 Middle East & Africa
- 3.5 Porter's analysis
- 3.6 PESTEL analysis
- 3.7 Technology and Innovation landscape
- 3.7.1 Current technological trends
- 3.7.2 Emerging technologies
- 3.8 Emerging Business Models
- 3.9 Compliance Requirements
- 3.10 Sustainability Measures
- 3.11 Consumer Sentiment Analysis
- 3.12 Patent and IP analysis
- 3.13 Geopolitical and trade dynamics
Chapter 4 Competitive Landscape, 2025
- 4.1 Introduction
- 4.2 Company market share analysis
- 4.2.1 By region
- 4.2.1.1 North America
- 4.2.1.2 Europe
- 4.2.1.3 Asia Pacific
- 4.2.1.4 Latin America
- 4.2.1.5 Middle East & Africa
- 4.2.2 Market Concentration Analysis
- 4.2.1 By region
- 4.3 Competitive Benchmarking of key Players
- 4.3.1 Financial Performance Comparison
- 4.3.1.1 Revenue
- 4.3.1.2 Profit Margin
- 4.3.1.3 R&D
- 4.3.2 Product Portfolio Comparison
- 4.3.2.1 Product Range Breadth
- 4.3.2.2 Technology
- 4.3.2.3 Innovation
- 4.3.3 Geographic Presence Comparison
- 4.3.3.1 Global Footprint Analysis
- 4.3.3.2 Service Network Coverage
- 4.3.3.3 Market Penetration by Region
- 4.3.4 Competitive Positioning Matrix
- 4.3.4.1 Leaders
- 4.3.4.2 Challengers
- 4.3.4.3 Followers
- 4.3.4.4 Niche Players
- 4.3.5 Strategic outlook matrix
- 4.3.1 Financial Performance Comparison
- 4.4 Key developments, 2021-2024
- 4.4.1 Mergers and Acquisitions
- 4.4.2 Partnerships and Collaborations
- 4.4.3 Technological Advancements
- 4.4.4 Expansion and Investment Strategies
- 4.4.5 Sustainability Initiatives
- 4.4.6 Digital Transformation Initiatives
- 4.5 Emerging/ Startup Competitors Landscape
Chapter 5 Market Estimates & Forecast, By Product, 2022-2035 (USD Million)
- 5.1 Key trends
- 5.2 Transceivers
- 5.3 Variable optical attenuator
- 5.4 Switch
- 5.5 Cable
- 5.6 Sensor
- 5.7 Others
Chapter 6 Market Estimates & Forecast, By Component, 2022-2035 (USD Million)
- 6.1 Key trends
- 6.2 Active
- 6.2.1 Laser
- 6.2.2 Modulator
- 6.2.3 Photodetector
- 6.2.4 Others
- 6.3 Passive
- 6.3.1 Filter
- 6.3.2 Waveguide
Chapter 7 Market Estimates & Forecast, By Application, 2022-2035 (USD Million)
- 7.1 Key trends
- 7.2 Data center & HPC
- 7.3 Telecommunications
- 7.4 Medical
- 7.5 Others
Chapter 8 Market Estimates & Forecast, By Region, 2022-2035 (USD Million)
- 8.1 Key trends
- 8.2 North America
- 8.2.1 U.S.
- 8.2.2 Canada
- 8.3 Europe
- 8.3.1 UK
- 8.3.2 Germany
- 8.3.3 France
- 8.3.4 Italy
- 8.3.5 Spain
- 8.3.6 Russia
- 8.4 Asia Pacific
- 8.4.1 China
- 8.4.2 India
- 8.4.3 Japan
- 8.4.4 South Korea
- 8.4.5 Australia
- 8.5 Latin America
- 8.5.1 Brazil
- 8.5.2 Mexico
- 8.6 MEA
- 8.6.1 South Africa
- 8.6.2 Saudi Arabia
- 8.6.3 UAE
Chapter 9 Company Profiles
- 9.1 Global Key Players
- 9.1.1 Intel
- 9.1.2 IBM
- 9.1.3 Cisco
- 9.1.4 Broadcom
- 9.1.5 Ciena
- 9.1.6 Juniper
- 9.2 Regional Key Players
- 9.2.1 North America
- 9.2.1.1 Finisar
- 9.2.1.2 Mellanox
- 9.2.1.3 Luxtera
- 9.2.1.4 Acacia
- 9.2.2 Europe
- 9.2.2.1 STMicroelectronics
- 9.2.2.2 Rockley Photonics
- 9.2.2.3 Reflex Photonics
- 9.2.2.4 Sicoya
- 9.2.3 Asia Pacific
- 9.2.3.1 Hamamatsu
- 9.2.3.2 Oclaro
- 9.2.3.3 Ranovus
- 9.2.3.4 GlobalFoundries
- 9.2.1 North America
- 9.3 Niche / Disruptors
- 9.3.1 Neophotonics

