
PUBLISHER: Global Market Insights Inc. | PRODUCT CODE: 1892894

PUBLISHER: Global Market Insights Inc. | PRODUCT CODE: 1892894
Electric Transporters Market Opportunity, Growth Drivers, Industry Trend Analysis, and Forecast 2026 - 2035
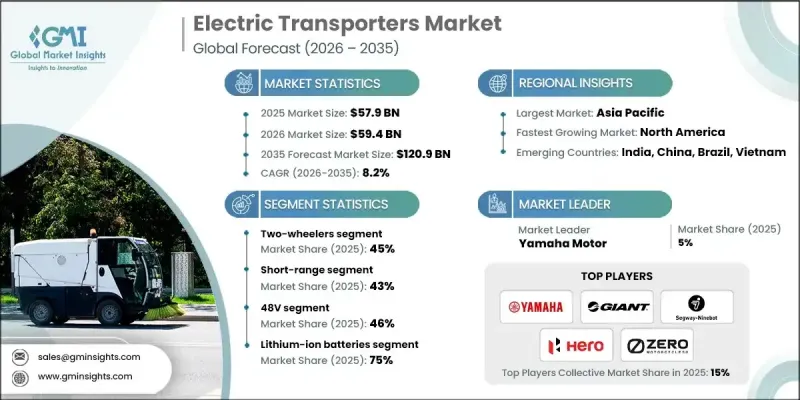
The Global Electric Transporters Market was valued at USD 57.9 billion in 2025 and is estimated to grow at a CAGR of 8.2% to reach USD 120.9 billion by 2035.
Businesses are steadily shifting toward electric mobility due to rising fuel costs and ongoing instability in conventional energy markets. As oil prices move toward USD 80 per barrel with an expected USD 5 per barrel increase, electric transporters are becoming cost-efficient alternatives that reduce both fuel spending and maintenance needs. These vehicles increasingly present a favorable total cost of ownership, particularly in regions with dependable electricity rates or strong access to renewable power. Rapid population growth in major cities continues to strain urban road networks, and more than 1 billion people still lack reliable all-weather roads. As traffic congestion worsens, compact electric transporters are gaining momentum. Expanding e-commerce is accelerating demand for electric cargo transporters used in last-mile delivery, while technological progress in standardized data formats and communication protocols is improving platform interoperability. Advancing regulatory clarity and global efforts to strengthen safety and compatibility are also helping accelerate adoption across consumer and commercial use cases.
| Market Scope | |
|---|---|
| Start Year | 2025 |
| Forecast Year | 2026-2035 |
| Start Value | $57.9 Billion |
| Forecast Value | $120.9 Billion |
| CAGR | 8.2% |
The two-wheeler segment held a 45% share in 2025 and is expected to grow at a CAGR of 8.5% from 2026 to 2035. This segment leads electrification because it requires relatively small battery systems, which helps sustain competitive pricing as industry-wide battery costs continue to decrease.
The short-range segment accounted for a 43% share in 2025 and is projected to grow at the highest rate of 8.6% through 2035. These vehicles are designed for daily urban trips under 100 km and make use of readily available charging infrastructure. Their lower cost, lightweight design, maneuverability, and ease of parking appeal to commuters and companies focused on micro-mobility and last-mile delivery.
Asia Pacific Electric Transporters Market captured 73% share in 2025 and is expected to grow at a CAGR of 7.8% throughout 2025-2034. Strong production activity in China and rising adoption in markets across India and Southeast Asia continue to influence regional dominance. China represents approximately 78% of global electric transporter sales volume, supported by widespread consumer acceptance, government-backed initiatives, and large-scale industry capacity.
Major companies in the Global Electric Transporters Market include Ather Energy, BMW Motorrad, Giant, Harley-Davidson, Hero MotoCorp, Niu Technologies, Segway Ninebot, Yadea Technology, Yamaha Motor, and Zero Motorcycles. Leading manufacturers are expanding their Electric Transporters Market presence by strengthening battery efficiency, improving motor performance, and prioritizing affordable product lines for urban users. Many companies are investing in modular platforms that allow them to scale models across multiple price tiers while optimizing production costs. Collaboration with charging infrastructure providers remains a core strategy as firms work to ensure convenient access to energy for users. Businesses are also forming alliances with fleet operators to increase adoption in commercial delivery applications. Continuous research in lightweight materials, safety systems, and digital connectivity helps brands differentiate their offerings. Manufacturers are further enhancing their reach by expanding global distribution networks and aligning with regional regulatory frameworks to accelerate certification and market entry.
Table of Contents
Chapter 1 Methodology
- 1.1 Market scope and definition
- 1.2 Research design
- 1.2.1 Research approach
- 1.2.2 Data collection methods
- 1.3 Data mining sources
- 1.3.1 Global
- 1.3.2 Regional/Country
- 1.4 Base estimates and calculations
- 1.4.1 Base year calculation
- 1.4.2 Key trends for market estimation
- 1.5 Primary research and validation
- 1.5.1 Primary sources
- 1.6 Forecast model
- 1.7 Research assumptions and limitations
Chapter 2 Executive Summary
- 2.1 Industry 3600 synopsis, 2022 - 2035
- 2.2 Key market trends
- 2.2.1 Regional
- 2.2.2 Electric Vehicle
- 2.2.3 Voltage
- 2.2.4 Battery
- 2.2.5 Range
- 2.2.6 Application
- 2.2.7 End Use
- 2.3 TAM Analysis, 2026-2035
- 2.4 CXO perspectives: Strategic imperatives
- 2.4.1 Executive decision points
- 2.4.2 Critical success factors
- 2.5 Future outlook and strategic recommendations
Chapter 3 Industry Insights
- 3.1 Industry ecosystem analysis
- 3.1.1 Supplier landscape
- 3.1.2 Profit margin analysis
- 3.1.3 Cost structure
- 3.1.4 Value addition at each stage
- 3.1.5 Factor affecting the value chain
- 3.1.6 Disruptions
- 3.2 Industry impact forces
- 3.2.1.1 Growth drivers
- 3.2.1.2 Urbanization and traffic congestion
- 3.2.1.3 Environmental concerns and regulatory support
- 3.2.1.4 Growth in e-commerce and logistics
- 3.2.1.5 Advances in battery technology and declining costs
- 3.2.1.6 Rising fuel prices and lower operating costs
- 3.2.2 Industry pitfalls and challenges
- 3.2.2.1 Limited charging infrastructure and range anxiety
- 3.2.2.2 High upfront costs and long payback period
- 3.2.3 Market opportunities
- 3.2.3.1 Expansion of last-mile delivery solutions
- 3.2.3.2 Development of battery-swapping and fast-charging infrastructure
- 3.2.3.3 Integration with smart city and urban mobility initiatives
- 3.2.3.4 Fleet electrification for logistics and public transport
- 3.2.3.5 Technological innovation and modular vehicle design
- 3.3 Growth potential analysis
- 3.4 Regulatory landscape
- 3.4.1 Global regulatory overview
- 3.4.1.1 North America regulatory framework
- 3.4.1.2 Europe regulatory framework
- 3.4.1.3 Asia Pacific regulatory framework
- 3.4.1.4 Latin America regulatory framework
- 3.4.1.5 Middle East & Africa regulatory framework
- 3.4.2 Safety standards & certifications
- 3.4.3 Cybersecurity & data privacy regulations
- 3.4.4 Environmental & emissions regulations
- 3.4.5 Regulatory compliance cost analysis
- 3.4.1 Global regulatory overview
- 3.5 Porter's analysis
- 3.6 PESTEL analysis
- 3.7 Technology and innovation landscape
- 3.7.1 Current technological trends
- 3.7.1.1 Battery technologies
- 3.7.1.2 Electric motor technologies
- 3.7.1.3 Power electronics & control systems
- 3.7.1.4 Connectivity & telematics
- 3.7.1.5 Charging infrastructure
- 3.7.2 Emerging technologies
- 3.7.2.1 Next-generation battery technologies
- 3.7.2.2 Advanced charging technologies
- 3.7.2.3 Autonomous & ADAS features
- 3.7.2.4 Advanced connectivity (emerging)
- 3.7.2.5 Vehicle-to-grid (V2G) technologies
- 3.7.1 Current technological trends
- 3.8 Price trends
- 3.8.1 By region
- 3.8.2 By product
- 3.9 Production statistics
- 3.9.1 Production hubs
- 3.9.2 Consumption hubs
- 3.9.3 Export and import
- 3.10 Pricing analysis & market economics
- 3.10.1 Pricing trends overview
- 3.10.2 Pricing by vehicle type
- 3.10.3 Regional pricing variations
- 3.10.4 Battery cost impact on vehicle pricing
- 3.10.5 Total cost of ownership (TCO) analysis
- 3.10.6 Government incentives & subsidies impact
- 3.10.7 Shared micromobility pricing models
- 3.10.8 Pricing elasticity analysis
- 3.10.9 Future pricing outlook
- 3.11 Cost breakdown analysis
- 3.11.1 Manufacturing cost structure
- 3.11.2 R&D cost analysis
- 3.11.3 Regulatory compliance costs
- 3.11.4 Distribution & logistics costs
- 3.11.5 Marketing & sales costs
- 3.11.6 Operational costs (shared mobility)
- 3.11.7 Charging infrastructure costs
- 3.11.8 Warranty & aftersales costs
- 3.11.9 Cost reduction roadmap
- 3.12 Patent analysis
- 3.13 Sustainability and environmental aspects
- 3.13.1 Sustainable practices
- 3.13.2 Waste reduction strategies
- 3.13.3 Energy efficiency in production
- 3.13.4 Eco-friendly Initiatives
- 3.13.5 Carbon footprint considerations
- 3.14 End use behavior analysis
- 3.14.1 Consumer adoption patterns
- 3.14.2 Usage patterns & trip characteristics
- 3.14.3 Mode choice & substitution analysis
- 3.14.4 Purchase decision factors
- 3.14.5 Shared mobility user behavior
- 3.14.6 Fleet operator decision-making
- 3.14.7 Transit agency procurement behavior
- 3.14.8 Safety perception & risk awareness
- 3.14.9 Brand loyalty & switching behavior
- 3.14.10 Future behavior trends
- 3.15 Risk assessment & mitigation framework
- 3.15.1 Technology risks
- 3.15.2 Regulatory & compliance risks
- 3.15.3 Supply chain risks
- 3.15.4 Market & competitive risks
- 3.15.5 Financial risks
- 3.15.6 Operational risks (shared mobility)
- 3.15.7 Reputational & brand risks
- 3.15.8 Environmental & climate risks
- 3.15.9 Insurance & liability risks
- 3.15.10 Risk prioritization matrix
- 3.16 Future outlook & opportunities
- 3.16.1 Emerging technology trends
- 3.16.2 Regulatory evolution & impact
- 3.16.3 Business model innovation
- 3.16.4 Investment opportunities
- 3.16.5 Strategic recommendations
- 3.16.6 Risk analysis & mitigation strategies
- 3.16.7 Scenario analysis
Chapter 4 Competitive Landscape, 2025
- 4.1 Introduction
- 4.2 Company market share analysis
- 4.2.1 North America
- 4.2.2 Europe
- 4.2.3 Asia Pacific
- 4.2.4 LATAM
- 4.2.5 MEA
- 4.3 Competitive analysis of major market players
- 4.4 Competitive positioning matrix
- 4.5 Strategic outlook matrix
- 4.6 Key developments
- 4.6.1 Mergers & acquisitions
- 4.6.2 Partnerships & collaborations
- 4.6.3 New Product Launches
- 4.6.4 Expansion Plans and funding
Chapter 5 Market Estimates & Forecast, By Electric Vehicle, 2022 - 2035 (USD Mn, Units)
- 5.1 Key trends
- 5.2 Two-wheelers
- 5.2.1 E-bikes
- 5.2.2 E-scooters
- 5.2.3 Electric motorcycles
- 5.3 Three-wheelers
- 5.4 Personal transporters
- 5.4.1 Skateboards
- 5.4.2 Hoverboards
Chapter 6 Market Estimates & Forecast, By Voltage, 2022 - 2035 (USD Mn, Units)
- 6.1 Key trends
- 6.2 24V
- 6.3 36V
- 6.4 48V
- 6.5 Above 48V
Chapter 7 Market Estimates & Forecast, By Battery, 2022 - 2035 (USD Mn, Units)
- 7.1 Key trends
- 7.2 Lithium-ion
- 7.3 Lead-acid
- 7.4 Nickel-metal hydride
- 7.5 Solid state
Chapter 8 Market Estimates & Forecast, By Range, 2022 - 2035 (USD Mn, Units)
- 8.1 Key trends
- 8.2 Short-range (urban, ≤100 km / day)
- 8.3 Mid-range (regional, 100-300 km / day)
- 8.4 Long-range (≥300 km / day)
Chapter 9 Market Estimates & Forecast, By Application, 2022 - 2035 (USD Mn, Units)
- 9.1 Key trends
- 9.2 Micro-mobility
- 9.3 Ridesharing
- 9.4 Freight & cargo transport
- 9.5 Public transport
- 9.6 Personal leisure
- 9.7 Others
Chapter 10 Market Estimates & Forecast, By End Use, 2022 - 2035 (USD Mn, Units)
- 10.1 Key trends
- 10.2 Personal purchase
- 10.3 Commercial enterprises
- 10.4 Government & Non-Profit Buyers
- 10.5 Industrial & Logistics
- 10.6 Others
Chapter 11 Market Estimates & Forecast, By Region, 2022 - 2035 (USD Mn, Units)
- 11.1 Key trends
- 11.2 North America
- 11.2.1 US
- 11.2.2 Canada
- 11.3 Europe
- 11.3.1 Germany
- 11.3.2 UK
- 11.3.3 France
- 11.3.4 Italy
- 11.3.5 Spain
- 11.3.6 Russia
- 11.3.7 Nordics
- 11.3.8 Portugal
- 11.3.9 Croatia
- 11.4 Asia Pacific
- 11.4.1 China
- 11.4.2 India
- 11.4.3 Japan
- 11.4.4 Australia
- 11.4.5 South Korea
- 11.4.6 Singapore
- 11.4.7 Thailand
- 11.4.8 Indonesia
- 11.4.9 Vietnam
- 11.5 Latin America
- 11.5.1 Brazil
- 11.5.2 Mexico
- 11.5.3 Argentina
- 11.6 MEA
- 11.6.1 South Africa
- 11.6.2 Saudi Arabia
- 11.6.3 UAE
- 11.6.4 Turkey
Chapter 12 Company Profiles
- 12.1 Global Players
- 12.1.1 Accell
- 12.1.2 Bosch eBike Systems
- 12.1.3 BYD Company
- 12.1.4 CATL (Contemporary Amperex Technology)
- 12.1.5 Energica Motor Company
- 12.1.6 NIU Technologies
- 12.1.7 Proterra
- 12.1.8 Segway Ninebot
- 12.1.9 Yadea
- 12.1.10 Zero Motorcycles
- 12.2 Regional Players
- 12.2.1 Giant Manufacturing
- 12.2.2 Harley-Davidson
- 12.2.3 Nova Bus
- 12.2.4 Stromer
- 12.2.5 Gazelle
- 12.2.6 Tern Bicycles
- 12.2.7 Gogoro
- 12.2.8 Ather Energy
- 12.2.9 Hero Motorcorp
- 12.2.10 Piaggio
- 12.3 Emerging Technology Innovators
- 12.3.1 Lime
- 12.3.2 Aventon Bikes
- 12.3.3 Tier Mobility
- 12.3.4 BMW Motorrad
- 12.3.5 Yamaha Motor

