
PUBLISHER: Global Market Insights Inc. | PRODUCT CODE: 1913322

PUBLISHER: Global Market Insights Inc. | PRODUCT CODE: 1913322
Usage-based Insurance (UBI) Market Opportunity, Growth Drivers, Industry Trend Analysis, and Forecast 2026 - 2035
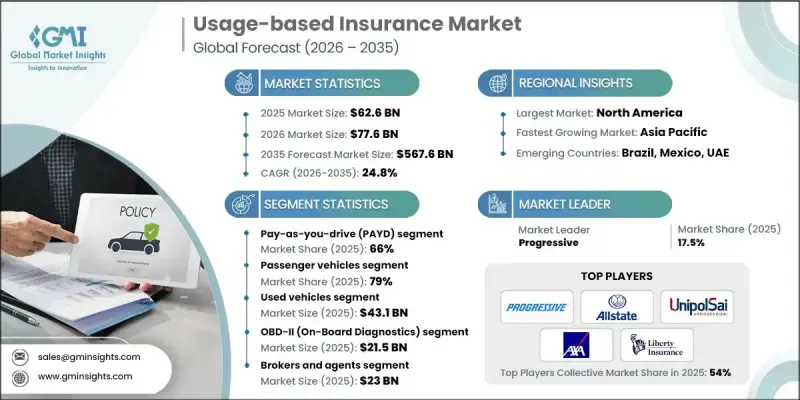
The Global Usage-based Insurance (UBI) Market was valued at USD 62.6 billion in 2025 and is estimated to grow at a CAGR of 24.8% to reach USD 567.6 billion by 2035.
The rapid growth reflects fundamental changes in how insurance risk is assessed and priced. Insurers are increasingly shifting away from static premium models toward dynamic, behavior-linked pricing structures that better align cost with real-world usage. Strong growth is being supported by the rising adoption of connected mobility solutions, growing consumer preference for personalized insurance offerings, and broader acceptance of analytics-driven underwriting. Usage-based insurance enables insurers to improve pricing accuracy, optimize risk exposure, and strengthen customer relationships by aligning premiums with actual usage patterns. The transition toward digital insurance ecosystems has further accelerated adoption, as data-centric platforms improve transparency, flexibility, and engagement throughout the policy lifecycle. These structural changes continue to position usage-based insurance as a core growth segment within the global insurance industry.
| Market Scope | |
|---|---|
| Start Year | 2025 |
| Forecast Year | 2026-2035 |
| Start Value | $62.6 Billion |
| Forecast Value | $567.6 Billion |
| CAGR | 24.8% |
Technological progress is reshaping the market by enabling continuous data collection, real-time risk evaluation, and automated policy management. Digital monitoring systems and advanced analytics platforms are allowing insurers to assess driving behavior more precisely and adjust pricing models dynamically. This technological foundation supports scalable insurance models that respond to changing consumer mobility patterns. Market expansion is further reinforced by rising adoption of usage-linked insurance structures, growing regulatory openness to data-driven pricing, and increasing consumer awareness of insurance solutions tied directly to usage and behavior.
The pay-as-you-drive segment accounted for 66% share in 2025 and is projected to grow at a CAGR of over 24.7% from 2026 to 2035. Its dominance is supported by straightforward implementation, transparent pricing logic, and strong appeal among drivers seeking cost alignment with actual vehicle usage.
The passenger vehicles segment held 79% share in 2025 and is expected to grow at a CAGR of 25.1% through 2035. This segment benefits from a broad insured base and strong alignment with personalized insurance structures that reflect individual driving habits and usage intensity.
U.S. Usage-based Insurance (UBI) Market held 78% share, generating USD 20 billion in 2025. The region benefits from a well-established insurance ecosystem, widespread digital adoption, and advanced implementation of data-enabled insurance platforms.
Key companies active in the Global Usage-based Insurance (UBI) Market include Progressive, Zurich Insurance, Metromile, Allianz, AXA, Liberty Mutual Insurance, UNIPOLSAI ASSICURAZIONI, State Farm Mutual Automobile Insurance Company, Octo Group, and Allstate. Companies operating in the Global Usage-based Insurance (UBI) Market are strengthening their competitive position through digital transformation, strategic partnerships, and customer-centric product design. Many insurers are investing heavily in advanced analytics and platform modernization to enhance risk modeling and pricing precision. Collaborations with mobility and technology providers are helping expand data access and improve service integration. Firms are also focusing on flexible policy structures that appeal to diverse driving behaviors and usage profiles.
Table of Contents
Chapter 1 Methodology & Scope
- 1.1 Market scope and definition
- 1.2 Research design
- 1.2.1 Research approach
- 1.2.2 Data collection methods
- 1.3 Data mining sources
- 1.3.1 Global
- 1.3.2 Regional/Country
- 1.4 Base estimates and calculations
- 1.4.1 Base year calculation
- 1.4.2 Key trends for market estimation
- 1.5 Primary research and validation
- 1.5.1 Primary sources
- 1.6 Forecast
- 1.7 Research assumptions and limitations
Chapter 2 Executive Summary
- 2.1 Industry 360° synopsis, 2022 - 2035
- 2.2 Key market trends
- 2.2.1 Regional
- 2.2.2 Package
- 2.2.3 Vehicle
- 2.2.4 Technology
- 2.2.5 Vehicle Age
- 2.2.6 Distribution channel
- 2.3 TAM Analysis, 2026-2035
- 2.4 CXO perspectives: Strategic imperatives
- 2.4.1 Executive decision points
- 2.4.2 Critical success factors
- 2.5 Future outlook and strategic recommendations
Chapter 3 Industry Insights
- 3.1 Industry ecosystem analysis
- 3.1.1 Supplier Landscape
- 3.1.2 Profit Margin
- 3.1.3 Cost structure
- 3.1.4 Value addition at each stage
- 3.1.5 Factor affecting the value chain
- 3.1.6 Disruptions
- 3.2 Industry impact forces
- 3.2.1 Growth drivers
- 3.2.1.1 Rapid growth of connected vehicles and telematics infrastructure
- 3.2.1.2 Rising demand for personalized and usage-linked insurance pricing
- 3.2.1.3 Advancements in AI, ML, and data analytics
- 3.2.1.4 Insurance sector digital transformation and regulatory acceptance
- 3.2.2 Industry pitfalls and challenges
- 3.2.2.1 Data privacy and cybersecurity concerns
- 3.2.2.2 Customer resistance to behavioral monitoring
- 3.2.3 Market opportunities
- 3.2.3.1 Rising adoption of telematics-enabled insurance:
- 3.2.3.2 High deployment and integration costs
- 3.2.3.3 Data accuracy and standardization issues
- 3.2.3.4 Partnerships with automotive OEMs and technology providers
- 3.2.1 Growth drivers
- 3.3 Growth potential analysis
- 3.4 Regulatory landscape
- 3.4.1 North America
- 3.4.1.1 U.S. NAIC Guidelines
- 3.4.1.2 State Insurance Departments Regulations
- 3.4.1.3 Canada OSFI & Provincial Insurance Guidelines
- 3.4.2 Europe
- 3.4.2.1 Germany BaFin Regulations
- 3.4.2.2 France ACPR & CNIL Guidelines
- 3.4.2.3 United Kingdom FCA & GDPR Compliance
- 3.4.2.4 Italy IVASS Guidelines
- 3.4.3 Asia Pacific
- 3.4.3.1 China CBIRC Guidelines
- 3.4.3.2 Japan FSA Compliance
- 3.4.3.3 South Korea FSS Regulations
- 3.4.3.4 India IRDAI Guidelines
- 3.4.4 Latin America
- 3.4.4.1 Brazil SUSEP Guidelines
- 3.4.4.2 Mexico CNSF Guidelines
- 3.4.5 Middle East and Africa
- 3.4.5.1 UAE Insurance Authority Guidelines
- 3.4.5.2 Saudi Arabia SAMA Regulations
- 3.4.1 North America
- 3.5 Porter's analysis
- 3.6 PESTEL analysis
- 3.7 Technology and Innovation Landscape
- 3.7.1 Current technological trends
- 3.7.2 Emerging technologies
- 3.8 Price trends
- 3.8.1 By region
- 3.8.2 By product
- 3.9 Cost breakdown analysis
- 3.10 Patent analysis
- 3.11 Sustainability and Environmental Aspects
- 3.11.1 Sustainable practices
- 3.11.2 Waste reduction strategies
- 3.11.3 Energy efficiency in production
- 3.11.4 Eco-friendly initiatives
- 3.11.5 Carbon footprint considerations
- 3.12 Use case scenarios
- 3.13 Actuarial modeling & risk scoring frameworks
- 3.13.1 Usage-based risk variables and weighting mechanisms
- 3.13.2 Driving behavior scoring methodologies
- 3.13.3 Integration of AI/ML in actuarial decision-making
- 3.14 Loss ratio & claims impact analysis
- 3.15 Customer adoption & behavioral economics analysis
- 3.16 Data ownership, monetization & privacy economics
- 3.17 OEM, telco & platform partnership models
- 3.18 Deployment models & operational architecture
- 3.19 Product differentiation & feature benchmarking
- 3.19.1 Feature comparison across major UBI offerings
- 3.19.2 Pricing, discount structures, and rewards models
- 3.19.3 Differentiation strategies among insurers
Chapter 4 Competitive Landscape, 2025
- 4.1 Introduction
- 4.2 Company market share analysis
- 4.2.1 North America
- 4.2.2 Europe
- 4.2.3 Asia Pacific
- 4.2.4 Latin America
- 4.2.5 Middle East & Africa
- 4.3 Competitive analysis of major market players
- 4.4 Competitive positioning matrix
- 4.5 Strategic outlook matrix
- 4.6 Key developments
- 4.6.1 Mergers & acquisitions
- 4.6.2 Partnerships & collaborations
- 4.6.3 New product launches
- 4.6.4 Expansion plans and funding
Chapter 5 Market Estimates & Forecast, By Package, 2022 - 2035 ($ Bn)
- 5.1 Key trends
- 5.2 Pay-How-You-Drive (PHYD)
- 5.3 Pay-As-You-Drive (PAYD)
- 5.3.1 Device- based
- 5.3.2 Telematics-based
- 5.4 Manage-How-You-Drive (MHYD)
Chapter 6 Market Estimates & Forecast, By Vehicle, 2022 - 2035 ($ Bn)
- 6.1 Key trends
- 6.2 Passenger vehicle
- 6.2.1 OBD-II
- 6.2.2 Black box
- 6.2.3 Smartphone
- 6.2.4 Embedded telematics
- 6.3 Commercial vehicle
- 6.3.1 Light commercial vehicles (LCVs)
- 6.3.1.1 OBD-II
- 6.3.1.2 Black box
- 6.3.1.3 Smartphone
- 6.3.1.4 Embedded telematics
- 6.3.2 Medium commercial vehicles (MCVs)
- 6.3.2.1 OBD-II
- 6.3.2.2 Black box
- 6.3.2.3 Smartphone
- 6.3.2.4 Embedded telematics
- 6.3.3 Heavy commercial vehicles (HCVs)
- 6.3.3.1 OBD-II
- 6.3.3.2 Black Box
- 6.3.3.3 Smartphone
- 6.3.3.4 Embedded telematics
- 6.3.1 Light commercial vehicles (LCVs)
Chapter 7 Market Estimates & Forecast, By Technology, 2022 - 2035 ($ Bn)
- 7.1 Key trends
- 7.2 OBD-II
- 7.3 Black box
- 7.4 Smartphone
- 7.5 Embedded telematics
Chapter 8 Market Estimates & Forecast, By Vehicle Age, 2022 - 2035 ($ Bn)
- 8.1 Key trends
- 8.2 New vehicles
- 8.3 Used vehicles
Chapter 9 Market Estimates & Forecast, By Distribution channel, 2022 - 2035 ($ Bn)
- 9.1 Key trends
- 9.2 Brokers and agents
- 9.3 Direct sales
- 9.4 Online platforms
- 9.5 Bancassurance
Chapter 10 Market Estimates & Forecast, By Region, 2022 - 2035 ($ Bn)
- 10.1 Key trends
- 10.2 North America
- 10.2.1 US
- 10.2.2 Canada
- 10.3 Europe
- 10.3.1 UK
- 10.3.2 Germany
- 10.3.3 France
- 10.3.4 Italy
- 10.3.5 Spain
- 10.3.6 Belgium
- 10.3.7 Netherlands
- 10.3.8 Sweden
- 10.4 Asia Pacific
- 10.4.1 China
- 10.4.2 India
- 10.4.3 Japan
- 10.4.4 Australia
- 10.4.5 Singapore
- 10.4.6 South Korea
- 10.4.7 Vietnam
- 10.4.8 Indonesia
- 10.5 Latin America
- 10.5.1 Brazil
- 10.5.2 Mexico
- 10.5.3 Argentina
- 10.6 MEA
- 10.6.1 UAE
- 10.6.2 South Africa
- 10.6.3 Saudi Arabia
Chapter 11 Company Profiles
- 11.1 Global Player
- 11.1.1 Allianz
- 11.1.2 Allstate
- 11.1.3 AXA
- 11.1.4 Liberty Mutual Insurance
- 11.1.5 Metromile
- 11.1.6 Octo Group
- 11.1.7 Progressive
- 11.1.8 State Farm Mutual Automobile Insurance Company
- 11.1.9 UNIPOLSAI ASSICURAZIONI
- 11.1.10 Zurich Insurance
- 11.2 Regional Player
- 11.2.1 Aviva
- 11.2.2 Chubb
- 11.2.3 Direct Line Insurance
- 11.2.4 Generali
- 11.2.5 ICICI Lombard
- 11.2.6 MAPFRE
- 11.2.7 RSA Insurance
- 11.2.8 Sompo
- 11.2.9 Suncorp
- 11.2.10 Tokio Marine
- 11.3 Emerging Players
- 11.3.1 By Miles
- 11.3.2 Cuvva
- 11.3.3 Noblr
- 11.3.4 Sureify
- 11.3.5 Zego

