
PUBLISHER: Global Market Insights Inc. | PRODUCT CODE: 1913364

PUBLISHER: Global Market Insights Inc. | PRODUCT CODE: 1913364
Electric Bus Market Opportunity, Growth Drivers, Industry Trend Analysis, and Forecast 2026 - 2035
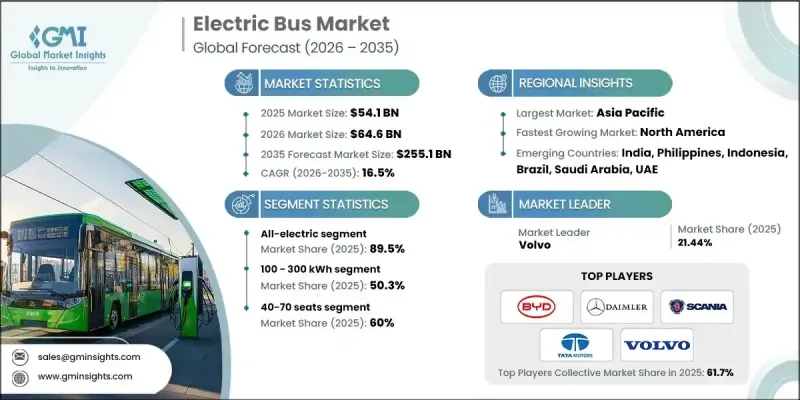
The Global Electric Bus Market was valued at USD 54.1 billion in 2025 and is estimated to grow at a CAGR of 16.5% to reach USD 255.1 billion by 2035.
The market is evolving rapidly as public transportation systems increasingly shift toward electrified mobility to support cleaner cities and more efficient transit operations. Electric buses are now designed with advanced battery systems, optimized electric drivetrains, intelligent energy management, and efficient thermal controls that enable lower operating expenses and improved service reliability. Transit authorities are adopting these vehicles to cut fuel and maintenance costs, lower emissions, and enhance rider comfort while modernizing aging fleets. Policy-driven commitments to decarbonization, air quality improvement, and sustainable urban development are directly accelerating electric bus adoption. Large-scale investments in charging infrastructure, fleet digitization, and operational analytics are allowing operators to maximize uptime and improve route planning. As electrification reduces dependence on conventional fuels, electric buses are increasingly viewed as a long-term solution that improves both environmental performance and economic stability across urban and intercity transport networks.
| Market Scope | |
|---|---|
| Start Year | 2025 |
| Forecast Year | 2026-2035 |
| Start Value | $54.1 Billion |
| Forecast Value | $255.1 Billion |
| CAGR | 16.5% |
The all-electric category represented 89.5% share in 2025 and is forecast to grow at a CAGR of 16.2% through 2035. This segment leads the market due to its zero-emission operation, reduced mechanical complexity, and strong regulatory backing. Transit operators favor fully electric buses as they align with emission reduction targets while offering lower lifetime ownership costs compared to alternative propulsion technologies.
The 100-300 kWh battery capacity range accounted for 50.3% share in 2025 and is expected to expand at a CAGR of 16.6% between 2026 and 2035. This battery class is widely adopted because it offers an effective balance between driving range, charging efficiency, and vehicle weight. Buses in this range support daily route requirements without excessive charging interruptions, helping operators maintain consistent schedules and control operational costs.
China Electric Bus Market held 65.5% share and generated USD 21.08 billion during 2025. Market leadership is supported by strong policy alignment, long-term fleet electrification programs, and widespread replacement of conventional buses with electric alternatives. Continuous investment in public transport modernization has sustained high deployment levels across metropolitan and regional networks.
Key companies operating in the Global Electric Bus Market include BYD, Solaris Bus & Coach, Tata Motors, Volvo, Zhongtong Bus, Proterra, Daimler, NFI Group, Scania, and MAN Bus. Companies in the Global Electric Bus Market are strengthening their competitive position through technology innovation, capacity expansion, and strategic partnerships. Manufacturers are investing heavily in battery efficiency improvements, modular vehicle platforms, and software-enabled fleet management solutions to enhance performance and reliability. Localization of manufacturing and supply chains is being used to reduce costs and meet regional procurement requirements. Firms are also offering comprehensive service packages that include maintenance support, charging solutions, and lifecycle management to build long-term customer relationships. Collaboration with transit authorities and infrastructure providers is enabling smoother deployment, while continuous product upgrades help address evolving regulatory and operational expectations across global markets.
Table of Contents
Chapter 1 Methodology
- 1.1 Research approach
- 1.2 Quality commitments
- 1.2.1 GMI AI policy & data integrity commitment
- 1.3 Research trail & confidence scoring
- 1.3.1 Research trail components
- 1.3.2 Scoring components
- 1.4 Data collection
- 1.4.1 Partial list of primary sources
- 1.5 Data mining sources
- 1.5.1 Paid sources
- 1.6 Base estimates and calculations
- 1.6.1 Base year calculation
- 1.7 Forecast model
- 1.8 Research transparency addendum
Chapter 2 Executive Summary
- 2.1 Industry 3600 synopsis, 2022 - 2035
- 2.2 Key market trends
- 2.2.1 Regional
- 2.2.2 Propulsion
- 2.2.3 Battery capacity
- 2.2.4 Seating capacity
- 2.2.5 Service
- 2.2.6 Fleet ownership
- 2.2.7 Charging infrastructure
- 2.3 TAM Analysis, 2026-2035
- 2.4 CXO perspectives: Strategic imperatives
- 2.4.1 Executive decision points
- 2.4.2 Critical success factors
- 2.5 Future outlook and strategic recommendations
Chapter 3 Industry Insights
- 3.1 Industry ecosystem analysis
- 3.1.1 Supplier landscape
- 3.1.2 Profit margin analysis
- 3.1.3 Cost structure
- 3.1.4 Value addition at each stage
- 3.1.5 Factor affecting the value chain
- 3.1.6 Disruptions
- 3.2 Industry impact forces
- 3.2.1 Growth drivers
- 3.2.1.1 Rise in government mandates for zero-emission public transportation
- 3.2.1.2 Surge in public funding and subsidies for electric bus procurement
- 3.2.1.3 Increase in urban air-quality concerns and sustainability targets
- 3.2.1.4 Growth in demand for lower total cost of ownership compared to diesel buses
- 3.2.1.5 Advancements in battery energy density and powertrain efficiency
- 3.2.2 Industry pitfalls and challenges
- 3.2.2.1 High upfront cost of electric buses and charging infrastructure
- 3.2.2.2 Limited charging infrastructure and grid capacity in developing regions
- 3.2.3 Market opportunities
- 3.2.3.1 Expansion of electric bus adoption in emerging economies
- 3.2.3.2 Growth in electrification of intercity and long-distance bus routes
- 3.2.3.3 Rise in battery swapping and energy-as-a-service business models
- 3.2.3.4 Increasing integration of electric buses into smart city initiatives
- 3.2.1 Growth drivers
- 3.3 Growth potential analysis
- 3.4 Regulatory landscape
- 3.4.1 North America
- 3.4.1.1 US Federal Electrification Incentives & Infrastructure Funding.
- 3.4.2 Europe
- 3.4.2.1 Germany: Electric Mobility Act (EmoG)
- 3.4.2.2 UK: Zero-Emission Bus Funding Programs
- 3.4.2.3 France: Mobility Orientation Law (LOM Act)
- 3.4.2.4 Italy: National Energy & Climate Plan (PNIEC)
- 3.4.3 Asia Pacific
- 3.4.3.1 China: New Energy Vehicle (NEV) Mandate
- 3.4.3.2 India: FAME II Electric Bus Incentives
- 3.4.3.3 Japan: National EV & FCV Deployment Roadmap
- 3.4.3.4 Australia: State-Level Zero-Emission Bus Targets
- 3.4.4 Latin America
- 3.4.4.1 Brazil: National Electric Mobility Policy (PNME)
- 3.4.4.2 Mexico: Urban Zero-Emission Public Transport Programs
- 3.4.4.3 Argentina: Provincial Clean Mobility Regulations
- 3.4.5 MEA
- 3.4.5.1 UAE: EV Charging & Clean Transport Regulations
- 3.4.5.2 Saudi Arabia: Vision 2030 EV Transport Framework
- 3.4.5.3 South Africa: Green Transport Strategy
- 3.4.1 North America
- 3.5 Porter's analysis
- 3.6 PESTEL analysis
- 3.7 Technology and Innovation landscape
- 3.7.1 Current technological trends
- 3.7.2 Emerging technologies
- 3.8 Patent analysis
- 3.9 Pricing Analysis
- 3.9.1 By region
- 3.9.2 By propulsion
- 3.10 Production statistics
- 3.10.1 Production hubs
- 3.10.2 Consumption hubs
- 3.10.3 Export and import
- 3.11 Cost breakdown analysis
- 3.11.1 Vehicle Cost
- 3.11.2 Operational Cost
- 3.11.3 Total cost of ownership (TCO)
- 3.11.4 Charging Infrastructure Cost
- 3.11.5 Installation & activation costs
- 3.11.6 Research & development costs
- 3.12 Sustainability and environmental impact analysis
- 3.12.1 Sustainable practices
- 3.12.2 Waste reduction strategies
- 3.12.3 Energy efficiency in production
- 3.12.4 Eco-friendly initiatives
- 3.12.5 Carbon footprint considerations
- 3.13 Future outlook & opportunities
- 3.13.1 Technology roadmap & evolution timeline
- 3.13.2 Emerging application opportunities
- 3.13.3 Investment requirements & funding sources
- 3.13.4 Risk assessment & mitigation strategies
- 3.13.5 Strategic recommendations for market participants
Chapter 4 Competitive Landscape, 2025
- 4.1 Introduction
- 4.2 Company market share analysis
- 4.2.1 North America
- 4.2.2 Europe
- 4.2.3 Asia Pacific
- 4.2.4 Latin America
- 4.2.5 MEA
- 4.3 Competitive analysis of major market players
- 4.4 Competitive positioning matrix
- 4.5 Strategic outlook matrix
- 4.6 Key developments
- 4.6.1 Mergers & acquisitions
- 4.6.2 Partnerships & collaborations
- 4.6.3 New Product Launches
- 4.6.4 Expansion Plans and funding
Chapter 5 Market Estimates & Forecast, By Propulsion, 2022 - 2035 ($Bn, Units)
- 5.1 Key trends
- 5.2 All-electric
- 5.3 PHEV
- 5.4 FCEV
Chapter 6 Market Estimates & Forecast, By Seating Capacity, 2022 - 2035 ($Bn, Units)
- 6.1 Key trends
- 6.2 Below 40
- 6.3 40-70
- 6.4 Above 70
Chapter 7 Market Estimates & Forecast, By Service, 2022 - 2035 ($Bn, Units)
- 7.1 Key trends
- 7.2 Intercity
- 7.3 Intracity
Chapter 8 Market Estimates & Forecast, By Fleet Ownership, 2022 - 2035 ($Bn, Units)
- 8.1 Key trends
- 8.2 Government
- 8.3 Private Fleet
- 8.4 Leasing & Rental
- 8.5 Ride-hailing Operator
- 8.6 Others
Chapter 9 Market Estimates & Forecast, By Charging Infrastructure, 2022 - 2035 ($Bn, Units)
- 9.1 Key trends
- 9.2 Public Charging Network
- 9.3 Private
- 9.4 Hybrid
Chapter 10 Market Estimates & Forecast, By Battery Capacity, 2022 - 2035 ($Bn, Units)
- 10.1 Key trends
- 10.2 Below 100 kWh
- 10.3 100-300 kWh
- 10.4 Above 300 kWh
Chapter 11 Market Estimates & Forecast, By Region, 2022 - 2035 ($Bn, Units)
- 11.1 Key trends
- 11.2 North America
- 11.2.1 US
- 11.2.2 Canada
- 11.3 Europe
- 11.3.1 Germany
- 11.3.2 UK
- 11.3.3 France
- 11.3.4 Italy
- 11.3.5 Spain
- 11.3.6 Russia
- 11.3.7 Nordics
- 11.4 Asia Pacific
- 11.4.1 China
- 11.4.2 India
- 11.4.3 Japan
- 11.4.4 Australia
- 11.4.5 South Korea
- 11.4.6 Philippines
- 11.4.7 Indonesia
- 11.5 Latin America
- 11.5.1 Brazil
- 11.5.2 Mexico
- 11.5.3 Argentina
- 11.6 MEA
- 11.6.1 South Africa
- 11.6.2 Saudi Arabia
- 11.6.3 UAE
Chapter 12 Company Profiles
- 12.1 Global Players
- 12.1.1 BYD
- 12.1.2 Daimler
- 12.1.3 Geely Automobile Holdings
- 12.1.4 IVECO
- 12.1.5 MAN Bus
- 12.1.6 NFI
- 12.1.7 Scania
- 12.1.8 Tata Motors
- 12.1.9 Volvo
- 12.1.10 Zhengzhou Yutong Bus
- 12.2 Regional Players
- 12.2.1 Beiqi Foton Motor
- 12.2.2 Ebusco
- 12.2.3 Irizar
- 12.2.4 King Long United Automotive
- 12.2.5 Solaris Bus & Coach
- 12.2.6 VDL Bus & Coach
- 12.2.7 Xiamen Golden Dragon Bus
- 12.3 Emerging Players
- 12.3.1 Anhui Ankai Automobile.
- 12.3.2 Proterra
- 12.3.3 Zhongtong Bus

