
PUBLISHER: Global Market Insights Inc. | PRODUCT CODE: 1913371

PUBLISHER: Global Market Insights Inc. | PRODUCT CODE: 1913371
Biphenyl Market Opportunity, Growth Drivers, Industry Trend Analysis, and Forecast 2026 - 2035
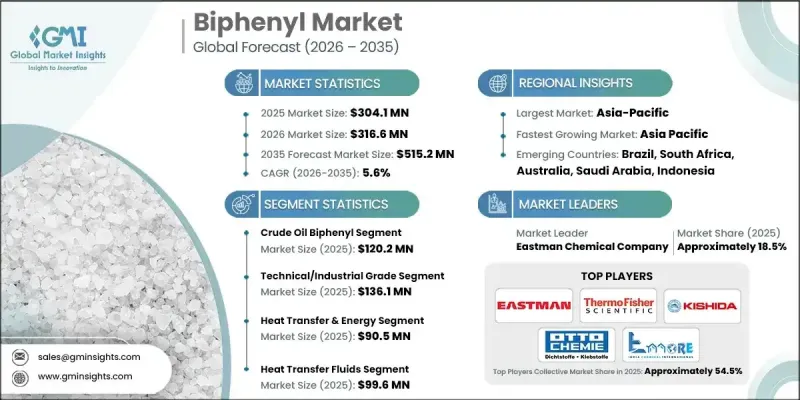
The Global Biphenyl Market was valued at USD 304.1 million in 2025 and is estimated to grow at a CAGR of 5.6% to reach USD 515.2 million by 2035.
Market growth is driven by the rising demand for biphenyl in the production of specialty chemicals. The pharmaceutical and agrochemical sectors increasingly rely on high-purity intermediates, making biphenyl a critical component in complex molecular formulations. Stricter regulatory requirements on chemical purity and performance are encouraging manufacturers to adopt biphenyl-based compounds for their stability and predictable results. Another significant driver is the expanding use of biphenyl as a heat transfer fluid and industrial solvent. Its excellent thermal stability and solubility make it ideal for high-performance industrial applications, particularly in the petrochemical and automotive sectors. Environmental and regulatory considerations also support biphenyl adoption, as its well-characterized safety profile and predictable behavior make it suitable for coatings, adhesives, plastics, and other regulated applications. Overall, the market is benefiting from a combination of industrial recovery, energy efficiency initiatives, and the need for reliable, compliant chemical solutions.
| Market Scope | |
|---|---|
| Start Year | 2025 |
| Forecast Year | 2026-2035 |
| Start Value | $304.1 Million |
| Forecast Value | $515.2 Million |
| CAGR | 5.6% |
The crude oil-based biphenyl segment was valued at USD 120.2 million in 2025 and is expected to grow at a CAGR of 5.1% from 2026 to 2035. Its production continues to benefit from established petrochemical facilities that support a consistent industrial supply. Coal tar-derived biphenyl remains relevant where integrated coke-oven processes are in place, enabling by-product utilization and cost-effective production. Natural gas-based biphenyl is gaining attention as cleaner processing routes are explored, helping the industry reduce emissions while improving efficiency.
The heat transfer and energy application segment accounted for USD 90.5 million in 2025 and is expected to grow at a CAGR of 5.3% through 2035. Biphenyl's functional properties support high-temperature operation, and its use in textiles, plastics processing, and regulated food and research applications contributes to steady market expansion.
North America Biphenyl Market was valued at USD 72.3 million in 2025. The region benefits from well-established chemical manufacturing networks, sustained investments in high-purity chemical production, and ongoing demand from pharmaceutical, specialty chemicals, and industrial energy sectors. Regulatory compliance and controlled industrial environments further support market stability and adoption.
Key companies active in the Global Biphenyl Market include Kishida Chemical Co., Ltd., Thermo Fisher Scientific, Eastman Chemical Company, Otto Chemie Pvt. Ltd., Ennore India Chemicals, and others. Market participants are strengthening their position by expanding high-purity biphenyl production capabilities, developing cleaner and more efficient synthesis processes, and diversifying feedstock sources to natural gas-based routes. Companies are also investing in R&D to enhance biphenyl applications in specialty chemicals, heat transfer media, and industrial solvents. Strategic partnerships with downstream chemical manufacturers and regional expansion initiatives help firms secure long-term contracts and global market share.
Table of Contents
Chapter 1 Methodology
- 1.1 Market scope and definition
- 1.2 Research design
- 1.2.1 Research approach
- 1.2.2 Data collection methods
- 1.3 Data mining sources
- 1.3.1 Global
- 1.3.2 Regional/Country
- 1.4 Base estimates and calculations
- 1.4.1 Base year calculation
- 1.4.2 Key trends for market estimation
- 1.5 Primary research and validation
- 1.5.1 Primary sources
- 1.6 Forecast model
- 1.7 Research assumptions and limitations
Chapter 2 Executive Summary
- 2.1 Industry 3600 synopsis
- 2.2 Key market trends
- 2.2.1 Regional
- 2.2.2 Source
- 2.2.3 Grade
- 2.2.4 End Use Industry
- 2.2.5 Application
- 2.3 TAM Analysis, 2026-2035
- 2.4 CXO perspectives: Strategic imperatives
- 2.4.1 Executive decision points
- 2.4.2 Critical success factors
- 2.5 Future Outlook and Strategic Recommendations
Chapter 3 Industry Insights
- 3.1 Industry ecosystem analysis
- 3.1.1 Supplier Landscape
- 3.1.2 Profit Margin
- 3.1.3 Value addition at each stage
- 3.1.4 Factor affecting the value chain
- 3.1.5 Disruptions
- 3.2 Industry impact forces
- 3.2.1 Growth drivers
- 3.2.2 Industry pitfalls and challenges
- 3.2.3 Market opportunities
- 3.3 Growth potential analysis
- 3.4 Regulatory landscape
- 3.4.1 North America
- 3.4.2 Europe
- 3.4.3 Asia Pacific
- 3.4.4 Latin America
- 3.4.5 Middle East & Africa
- 3.5 Porter's analysis
- 3.6 PESTEL analysis
- 3.7 Price trends
- 3.7.1 By region
- 3.7.2 By product
- 3.8 Future market trends
- 3.9 Technology and Innovation landscape
- 3.9.1 Current technological trends
- 3.9.2 Emerging technologies
- 3.10 Patent Landscape
- 3.11 Trade statistics (Note: the trade statistics will be provided for key countries only)
- 3.11.1 Major importing countries
- 3.11.2 Major exporting countries
- 3.12 Sustainability and Environmental Aspects
- 3.12.1 Sustainable Practices
- 3.12.2 Waste Reduction Strategies
- 3.12.3 Energy Efficiency in Production
- 3.12.4 Eco-friendly Initiatives
- 3.13 Carbon Footprint Considerations
Chapter 4 Competitive Landscape, 2025
- 4.1 Introduction
- 4.2 Company market share analysis
- 4.2.1 By region
- 4.2.1.1 North America
- 4.2.1.2 Europe
- 4.2.1.3 Asia Pacific
- 4.2.1.4 LATAM
- 4.2.1.5 MEA
- 4.2.1 By region
- 4.3 Company matrix analysis
- 4.4 Competitive analysis of major market players
- 4.5 Competitive positioning matrix
- 4.6 Key developments
- 4.6.1 Mergers & acquisitions
- 4.6.2 Partnerships & collaborations
- 4.6.3 New Product Launches
- 4.6.4 Expansion Plans
Chapter 5 Market Estimates and Forecast, By Source, 2022 - 2035 (USD Million, Kilo Tons)
- 5.1 Key trends
- 5.2 Crude oil biphenyl
- 5.3 Coal tar biphenyl
- 5.4 Natural gas biphenyl
Chapter 6 Market Estimates and Forecast, By Grade, 2022 - 2035 (USD Million, Kilo Tons)
- 6.1 Key trends
- 6.2 Pharmaceutical/analytical grade
- 6.3 Electronic/lcd grade
- 6.4 Technical/industrial grade
- 6.5 Research/laboratory grade
Chapter 7 Market Estimates and Forecast, By End Use Industry, 2022 - 2035 (USD Million, Kilo Tons)
- 7.1 Key trends
- 7.2 Pharmaceuticals
- 7.3 Agrochemicals (pesticides, fungicides, herbicides, insecticides)
- 7.4 Electronics & display (LCD, OLED, photovoltaics)
- 7.5 Heat transfer & energy
- 7.6 Textiles
- 7.7 Food & beverage
- 7.8 Plastics & polymers
- 7.9 Research & analytical
Chapter 8 Market Estimates and Forecast, By Application, 2022 - 2035 (USD Million, Kilo Tons)
- 8.1 Key trends
- 8.2 Heat transfer fluids
- 8.3 Chemical intermediate
- 8.4 Fungicide
- 8.5 Dyestuff carrier
- 8.6 Food preservatives & fungistats
- 8.7 Pharmaceutical solvents
Chapter 9 Market Estimates and Forecast, By Region, 2022 - 2035 (USD Million, Kilo Tons)
- 9.1 Key trends
- 9.2 North America
- 9.2.1 U.S.
- 9.2.2 Canada
- 9.3 Europe
- 9.3.1 Germany
- 9.3.2 UK
- 9.3.3 France
- 9.3.4 Italy
- 9.3.5 Spain
- 9.3.6 Rest of Europe
- 9.4 Asia Pacific
- 9.4.1 China
- 9.4.2 India
- 9.4.3 Japan
- 9.4.4 Australia
- 9.4.5 South Korea
- 9.4.6 Rest of Asia Pacific
- 9.5 Latin America
- 9.5.1 Brazil
- 9.5.2 Mexico
- 9.5.3 Argentina
- 9.5.4 Rest of Latin America
- 9.6 Middle East & Africa
- 9.6.1 Saudi Arabia
- 9.6.2 South Africa
- 9.6.3 UAE
- 9.6.4 Rest of Middle East & Africa
Chapter 10 Company Profiles
- 10.1 Eastman Chemical Company
- 10.2 Kanto Chemical Co., Inc.
- 10.3 Kishida Chemical Co., Ltd.
- 10.4 Ennore India Chemicals
- 10.5 Matrix Scientific
- 10.6 LGC Standards
- 10.7 Taj Pharmaceuticals Ltd.
- 10.8 Biosynth Carbosynth
- 10.9 Otto Chemie Pvt. Ltd.
- 10.10 Thermo Fisher Scientific

