
PUBLISHER: Global Market Insights Inc. | PRODUCT CODE: 1913373

PUBLISHER: Global Market Insights Inc. | PRODUCT CODE: 1913373
Pea Starch Market Opportunity, Growth Drivers, Industry Trend Analysis, and Forecast 2026 - 2035
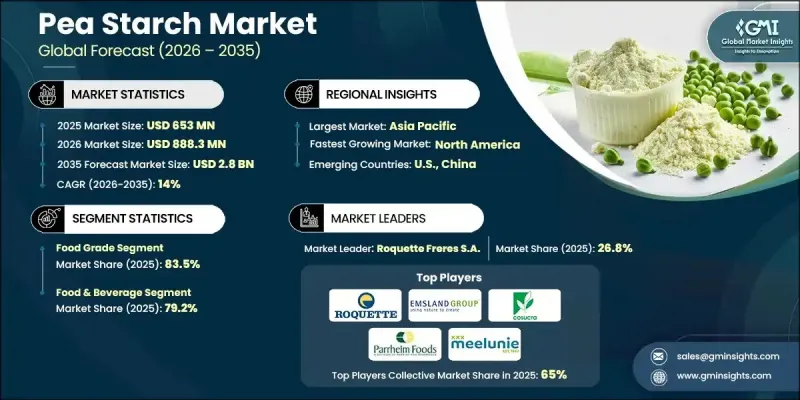
The Global Pea Starch Market was valued at USD 653 million in 2025 and is estimated to grow at a CAGR of 14% to reach USD 2.8 billion by 2035.
Market expansion is driven by structural changes within the global food and beverage sector, where manufacturers increasingly rely on plant-based ingredients to improve functionality, texture, and nutritional positioning. Pea starch is gaining strong traction as a versatile ingredient used across a wide range of processed and packaged food formulations due to its favorable performance characteristics and compatibility with clean-label trends. Shifts in consumer eating patterns toward convenience-oriented and health-conscious food options are supporting steady demand growth, particularly in developed economies. At the same time, rapid urbanization, rising disposable incomes, and lifestyle changes across emerging markets are accelerating the consumption of packaged foods, further strengthening market momentum. The European food industry is also contributing to growth as manufacturers prioritize plant-derived ingredients to meet evolving regulatory standards and consumer expectations related to transparency and sustainability. Together, these dynamics are positioning pea starch as a high-growth ingredient within the global starch and specialty carbohydrate landscape.
| Market Scope | |
|---|---|
| Start Year | 2025 |
| Forecast Year | 2026-2035 |
| Start Value | $653 Million |
| Forecast Value | $2.8 Billion |
| CAGR | 14% |
The food-grade products segment accounted for 83.5% share in 2025, supported by its superior quality standards and widespread use in human consumption applications. Certification and compliance requirements continue to shape product adoption within this segment.
The food & beverage segment held 79.2% share in 2025, driven by the functional advantages pea starch offers over alternative starch sources, including performance consistency and formulation efficiency.
North America Pea Starch Market held 17% share in 2025, with growth primarily supported by steady expansion in the U.S. food industry and increasing demand for convenient and processed food products.
Key companies operating in the Global Pea Starch Market include Roquette Freres S.A., Cosucra-Groupe Warcoing, Emsland-Starke GmbH, Vestkorn Milling AS, AGT Food and Ingredients Inc., Meelunie B.V., Dakota Dry Bean Inc., The Scoular Company, American Key Products Inc., Parrheim Foods, Yantai Oriental Protein Tech Co. Ltd., Qingdao CBH Co., Ltd., Shandong Jianyuan Bioengineering Co., Ltd., and Yantai T.Full Biotech Co Ltd. Companies in the Global Pea Starch Market are strengthening their competitive position by expanding processing capacities and securing long-term raw material sourcing agreements to ensure supply stability. Continuous investment in product innovation allows manufacturers to improve functional performance and tailor starch solutions for specific application needs. Strategic collaborations with food processors support the co-development of customized formulations and accelerate market penetration. Firms are also focusing on certifications, clean-label compliance, and sustainability messaging to align with evolving consumer and regulatory expectations.
Table of Contents
Chapter 1 Methodology & Scope
- 1.1 Market scope and definition
- 1.2 Research design
- 1.2.1 Research approach
- 1.2.2 Data collection methods
- 1.3 Data mining sources
- 1.3.1 Global
- 1.3.2 Regional/Country
- 1.4 Base estimates and calculations
- 1.4.1 Base year calculation
- 1.4.2 Key trends for market estimation
- 1.5 Primary research and validation
- 1.5.1 Primary sources
- 1.6 Forecast model
- 1.7 Research assumptions and limitations
Chapter 2 Executive Summary
- 2.1 Industry 360° synopsis
- 2.2 Key market trends
- 2.2.1 Regional
- 2.2.2 Product
- 2.2.3 End Use
- 2.3 TAM Analysis, 2026-2035
- 2.4 CXO perspectives: Strategic imperatives
- 2.4.1 Executive decision points
- 2.4.2 Critical success factors
- 2.5 Future Outlook and Strategic Recommendations
Chapter 3 Industry Insights
- 3.1 Industry ecosystem analysis
- 3.1.1 Supplier landscape
- 3.1.2 Profit margin
- 3.1.3 Value addition at each stage
- 3.1.4 Factor affecting the value chain
- 3.1.5 Disruptions
- 3.2 Industry impact forces
- 3.2.1 Growth drivers
- 3.2.2 Industry pitfalls and challenges
- 3.2.3 Market opportunities
- 3.3 Growth potential analysis
- 3.4 Regulatory landscape
- 3.4.1 North America
- 3.4.2 Europe
- 3.4.3 Asia Pacific
- 3.4.4 Latin America
- 3.4.5 Middle East & Africa
- 3.5 Porter's analysis
- 3.6 PESTEL analysis
- 3.7 Price trends
- 3.7.1 By region
- 3.7.2 By form
- 3.8 Future market trends
- 3.9 Technology and Innovation landscape
- 3.9.1 Current technological trends
- 3.9.2 Emerging technologies
- 3.10 Patent Landscape
- 3.11 Trade statistics (HS code)
( Note: The trade statistics will be provided for key countries only)
- 3.11.1 Major importing countries
- 3.11.2 Major exporting countries
Chapter 4 Competitive Landscape, 2025
- 4.1 Introduction
- 4.2 Company market share analysis
- 4.2.1 By region
- 4.2.1.1 North America
- 4.2.1.2 Europe
- 4.2.1.3 Asia Pacific
- 4.2.1.4 LATAM
- 4.2.1.5 MEA
- 4.2.1 By region
- 4.3 Company matrix analysis
- 4.4 Competitive analysis of major market players
- 4.5 Competitive positioning matrix
- 4.6 Key developments
- 4.6.1 Mergers & acquisitions
- 4.6.2 Partnerships & collaborations
- 4.6.3 New Product Launches
- 4.6.4 Expansion Plans
Chapter 5 Market Estimates and Forecast, By Product, 2022-2035 (USD Billion & Tons)
- 5.1 Key trends
- 5.2 Food grade
- 5.3 Industrial grade
- 5.4 Feed grade
Chapter 6 Market Estimates and Forecast, By Application, 2022-2035 (USD Billion & Tons)
- 6.1 Key trends
- 6.2 Pharmaceutical
- 6.3 Food & beverage
- 6.3.1 Bakery & Confectionery
- 6.3.2 Dairy Products
- 6.3.3 Soups, Sauces & Dressings
- 6.3.4 Snacks & Convenience Foods
- 6.4 Animal feed
- 6.5 Paper & textiles
- 6.6 Others
- 6.6.1 Adhesives
- 6.6.2 Bioplastics
Chapter 7 Market Estimates and Forecast, By Functionality, 2022-2035 (USD Billion & Tons)
- 7.1 Key trends
- 7.2 Thickening Agent
- 7.3 Binding Agent
- 7.4 Gelling Agent
- 7.5 Film-forming Agent
- 7.6 Texturizing Agent
Chapter 8 Market Estimates and Forecast, By Distribution Channel, 2022-2035 (USD Billion & Tons)
- 8.1 Key trends
- 8.2 Direct Sales (B2B)
- 8.3 Retail
- 8.3.1 Supermarkets
- 8.3.2 Specialty Stores
- 8.3.3 Others
- 8.4 Online Channels
Chapter 9 Market Estimates and Forecast, By Region, 2022-2035 (USD Billion & Tons)
- 9.1 Key trends
- 9.2 North America
- 9.2.1 U.S.
- 9.2.2 Canada
- 9.3 Europe
- 9.3.1 Germany
- 9.3.2 UK
- 9.3.3 France
- 9.3.4 Spain
- 9.3.5 Italy
- 9.3.6 Rest of Europe
- 9.4 Asia Pacific
- 9.4.1 China
- 9.4.2 India
- 9.4.3 Japan
- 9.4.4 Australia
- 9.4.5 South Korea
- 9.4.6 Rest of Asia Pacific
- 9.5 Latin America
- 9.5.1 Brazil
- 9.5.2 Mexico
- 9.5.3 Argentina
- 9.5.4 Rest of Latin America
- 9.6 Middle East and Africa
- 9.6.1 Saudi Arabia
- 9.6.2 South Africa
- 9.6.3 UAE
- 9.6.4 Rest of Middle East and Africa
Chapter 10 Company Profiles
- 10.1 Roquette Freres S.A.
- 10.2 Yantai Oriental Protein Tech Co. Ltd.
- 10.3 Cosucra-Groupe Warcoing
- 10.4 Emsland-Starke GmbH
- 10.5 Shandong Jianyuan Bioengineering Co., Ltd.
- 10.6 Vestkorn Milling AS
- 10.7 Dakota Dry Bean Inc.
- 10.8 Yantai T.Full Biotech Co Ltd.
- 10.9 Parrheim Foods
- 10.10 Meelunie B.V.
- 10.11 American Key Products Inc.
- 10.12 AGT Food and Ingredients Inc.
- 10.13 The Scoular Company
- 10.14 Qingdao CBH Co., Ltd.

