
PUBLISHER: Global Market Insights Inc. | PRODUCT CODE: 1913434

PUBLISHER: Global Market Insights Inc. | PRODUCT CODE: 1913434
Video on Demand Market Opportunity, Growth Drivers, Industry Trend Analysis, and Forecast 2026 - 2035
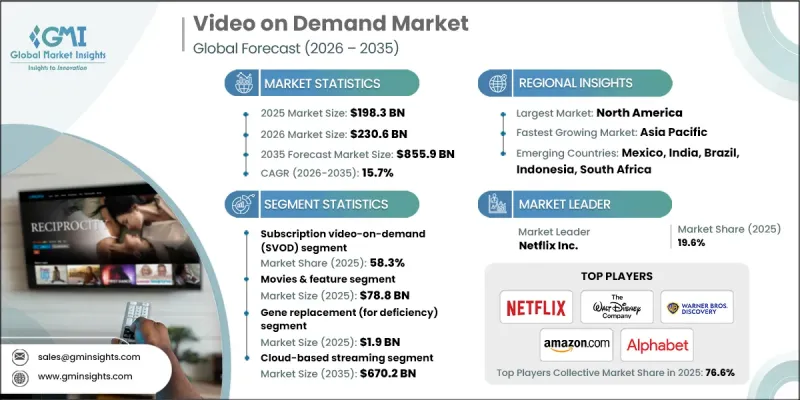
The Global Video on Demand Market was valued at USD 198.3 billion in 2025 and is estimated to grow at a CAGR of 15.7% to reach USD 855.9 billion by 2035.
The growth is driven by the widespread availability of high-speed internet connectivity and the growing adoption of cloud-based content delivery architectures. Consumers increasingly prefer flexible access to entertainment that fits their schedules and lifestyles, which has significantly increased demand for on-the-go and personalized viewing experiences. Continuous improvements in streaming quality, user interfaces, and connected device ecosystems have expanded adoption across all age groups. Smart televisions, mobile devices, and multi-screen environments are reshaping content consumption habits, allowing viewers to access video content seamlessly across platforms. Investments in network infrastructure and streaming technologies continue to strengthen reliability and viewing quality. As digital entertainment ecosystems mature, video on demand platforms are becoming central to global media consumption, supported by evolving consumer expectations and technological innovation.
| Market Scope | |
|---|---|
| Start Year | 2025 |
| Forecast Year | 2026-2035 |
| Start Value | $198.3 Billion |
| Forecast Value | $855.9 Billion |
| CAGR | 15.7% |
Ongoing advancements in content delivery networks, adaptive streaming technologies, and cross-device compatibility continue to reinforce the video-on-demand ecosystem. Platforms are dedicating significant resources to infrastructure upgrades to ensure consistent performance and high-quality playback. Video on demand services allow users to choose when and how they consume content, offering flexible access models that include subscription-based and advertising-supported options across multiple devices.
The subscription-based video on demand segment accounted for 58.3% share in 2025. This model remains dominant due to its ability to generate stable recurring revenue, enabling continuous investment in exclusive programming and platform enhancements. High adoption levels across developed and emerging regions highlight strong consumer preference for unlimited, on-demand access to entertainment content.
The movies and feature films segment generated USD 78.8 billion in 2025 and is projected to reach USD 321 billion by 2035. Demand for premium releases, original productions, and extensive content libraries continues to drive engagement and platform differentiation across global markets.
North America Video on Demand Market held a 37.2% share of the global video on demand market in 2025. Strong digital infrastructure, favorable regulatory conditions, and high broadband penetration support regional dominance. Mature content ecosystems and shifting consumer preferences toward personalized viewing and over-the-top services continue to accelerate growth.
Key companies operating in the Global Video on Demand Market include Netflix Inc., Amazon.com, Inc., The Walt Disney Company, Alphabet Inc., Apple Inc., Tencent Holdings Ltd., Sony Group Corporation, Warner Bros. Discovery, Inc., Paramount Global, Comcast Corporation, Roku, Inc., Alibaba Group Holding Ltd., Fox Corporation, British Broadcasting Corporation, Vivendi SE, Telefonica S.A., ITV plc, Baidu, Inc., Fandango Media, LLC, and Zee Entertainment Enterprises Ltd. These companies compete through content investment, technology leadership, and global reach. Companies in the Global Video on Demand Market are strengthening their market position by prioritizing innovation, sustainability, and consumer convenience. Manufacturers are focusing on developing durable, ergonomic, and efficient products that address evolving household needs. Sustainability-driven strategies, including reduced material usage and recyclable components, are gaining importance.
Table of Contents
Chapter 1 Methodology
- 1.1 Market scope and definition
- 1.2 Research design
- 1.2.1 Research approach
- 1.2.2 Data collection methods
- 1.3 Data mining sources
- 1.3.1 Global
- 1.3.2 Regional/Country
- 1.4 Base estimates and calculations
- 1.4.1 Base year calculation
- 1.4.2 Key trends for market estimation
- 1.5 Primary research and validation
- 1.5.1 Primary sources
- 1.6 Forecast model
- 1.7 Research assumptions and limitations
Chapter 2 Executive Summary
- 2.1 Industry 3600 synopsis, 2022 - 2035
- 2.2 Key market trends
- 2.2.1 Business trends
- 2.2.2 Service model trends
- 2.2.3 Content type trends
- 2.2.4 Device trends
- 2.2.5 Deployment trends
- 2.2.6 End User trends
- 2.2.7 Regional trends
- 2.3 TAM analysis, 2026-2035
- 2.4 CXO perspectives: Strategic imperatives
- 2.4.1 Executive decision points
- 2.4.2 Critical success factors
- 2.5 Future outlook and strategic recommendations
Chapter 3 Industry Insights
- 3.1 Industry ecosystem analysis
- 3.1.1 Supplier landscape
- 3.1.2 Profit margin analysis
- 3.1.3 Cost structure
- 3.1.4 Value addition at each stage
- 3.1.5 Factor affecting the value chain
- 3.1.6 Disruptions
- 3.2 Industry impact forces
- 3.2.1 Growth drivers
- 3.2.1.1 Expanding High-Speed Broadband and 5G Infrastructure
- 3.2.1.2 Rising Adoption of Smart Devices and Connected TVs
- 3.2.1.3 Increasing Investments in Original and Exclusive Content
- 3.2.1.4 Growth of Ad-Supported Streaming Models (AVOD/Hybrid Plans)
- 3.2.1.5 Strategic Partnerships with Telecom Operators and Device Manufacturers
- 3.2.2 Industry pitfalls and challenges
- 3.2.2.1 High Content Acquisition and Production Costs Impacting Profitability
- 3.2.2.2 Intense Competition Leading to Subscriber Churn and Pricing Pressure
- 3.2.3 Market opportunities
- 3.2.3.1 Expansion into emerging markets
- 3.2.3.2 Growth of ad-supported and hybrid streaming models
- 3.2.3.3 Integration of AI-driven personalization and content recommendation
- 3.2.3.4 Expansion into live streaming and interactive content formats
- 3.2.1 Growth drivers
- 3.3 Growth potential analysis
- 3.4 Regulatory landscape
- 3.4.1 North America
- 3.4.2 Europe
- 3.4.3 Asia Pacific
- 3.4.4 Latin America
- 3.4.5 Middle East & Africa
- 3.5 Porter's analysis
- 3.6 PESTEL analysis
- 3.7 Technology and innovation landscape
- 3.7.1 Current technological trends
- 3.7.2 Emerging technologies
- 3.8 Emerging business models
- 3.9 Compliance requirements
- 3.10 Patent and IP analysis
- 3.11 Geopolitical and trade dynamics
Chapter 4 Competitive Landscape, 2025
- 4.1 Introduction
- 4.2 Company market share analysis
- 4.2.1 By region
- 4.2.1.1 North America
- 4.2.1.2 Europe
- 4.2.1.3 Asia Pacific
- 4.2.1.4 Latin America
- 4.2.1.5 Middle East & Africa
- 4.2.1 By region
- 4.3 Competitive benchmarking of key players
- 4.3.1 Financial performance comparison
- 4.3.1.1 Revenue
- 4.3.1.2 Profit margin
- 4.3.1.3 R&D
- 4.3.2 Product portfolio comparison
- 4.3.2.1 Product range breadth
- 4.3.2.2 Technology
- 4.3.2.3 Innovation
- 4.3.3 Geographic presence comparison
- 4.3.3.1 Global footprint analysis
- 4.3.3.2 Service network coverage
- 4.3.3.3 Market penetration by region
- 4.3.4 Competitive positioning matrix
- 4.3.4.1 Leaders
- 4.3.4.2 Challengers
- 4.3.4.3 Followers
- 4.3.4.4 Niche players
- 4.3.5 Strategic outlook matrix
- 4.3.1 Financial performance comparison
- 4.4 Key developments, 2022-2025
- 4.4.1 Mergers and acquisitions
- 4.4.2 Partnerships and collaborations
- 4.4.3 Technological advancements
- 4.4.4 Expansion and investment strategies
- 4.4.5 Digital transformation initiatives
- 4.5 Emerging/ startup competitors landscape
Chapter 5 Market Estimates and Forecast, By Service Model, 2022 - 2035 (USD Billion)
- 5.1 Key trends
- 5.2 Subscription Video on Demand (SVOD)
- 5.3 Advertising-Supported Video on Demand (AVOD)
- 5.4 Transactional Video on Demand (TVOD)
- 5.5 Pay-Per-View (PPV)
- 5.6 Hybrid VoD Models
Chapter 6 Market Estimates and Forecast, By Content Type, 2022 - 2035 (USD Billion)
- 6.1 Key trends
- 6.2 Movies & feature films
- 6.3 TV series
- 6.4 Sports
- 6.5 News & live broadcasts
- 6.6 Kids & educational content
- 6.7 Others
Chapter 7 Market Estimates and Forecast, By Device, 2022 - 2035 (USD Billion)
- 7.1 Key trends
- 7.2 Smartphones & tablets
- 7.3 Smart TVs
- 7.4 Laptops & desktops
- 7.5 OTT streaming devices
- 7.6 Others
Chapter 8 Market Estimates and Forecast, By Deployment, 2022 - 2035 (USD Billion)
- 8.1 Key trends
- 8.2 Cloud-based streaming
- 8.3 On-premise/managed streaming solutions
- 8.4 Hybrid content delivery networks
Chapter 9 Market Estimates and Forecast, By End Use, 2022 - 2035 (USD Billion)
- 9.1 Key trends
- 9.2 Individual consumers
- 9.3 Enterprises & corporate learning
Chapter 10 Market Estimates & Forecast, By Region, 2022 - 2035 (USD Billion)
- 10.1 Key trends
- 10.2 North America
- 10.2.1 U.S.
- 10.2.2 Canada
- 10.3 Europe
- 10.3.1 Germany
- 10.3.2 UK
- 10.3.3 France
- 10.3.4 Italy
- 10.3.5 Spain
- 10.3.6 Netherlands
- 10.4 Asia Pacific
- 10.4.1 China
- 10.4.2 India
- 10.4.3 Japan
- 10.4.4 Australia
- 10.4.5 South Korea
- 10.5 Latin America
- 10.5.1 Brazil
- 10.5.2 Mexico
- 10.5.3 Argentina
- 10.6 MEA
- 10.6.1 South Africa
- 10.6.2 Saudi Arabia
- 10.6.3 UAE
Chapter 11 Company Profiles
- 11.1 Alibaba Group Holding Ltd.
- 11.2 Alphabet Inc.
- 11.3 Amazon.com, Inc.
- 11.4 Apple Inc.
- 11.5 Baidu, Inc.
- 11.6 British Broadcasting Corporation (BBC)
- 11.7 Comcast Corporation
- 11.8 Fandango Media, LLC
- 11.9 Fox Corporation
- 11.10 ITV plc
- 11.11 Netflix Inc.
- 11.12 Paramount Global
- 11.13 Roku, Inc.
- 11.14 Sony Group Corporation
- 11.15 Telefonica S.A.
- 11.16 Tencent Holdings Ltd.
- 11.17 The Walt Disney Company
- 11.18 Vivendi SE
- 11.19 Warner Bros. Discovery, Inc.
- 11.20 Zee Entertainment Enterprises Ltd.

