
PUBLISHER: Global Market Insights Inc. | PRODUCT CODE: 1913458

PUBLISHER: Global Market Insights Inc. | PRODUCT CODE: 1913458
Resistant Starch Market Opportunity, Growth Drivers, Industry Trend Analysis, and Forecast 2026 - 2035
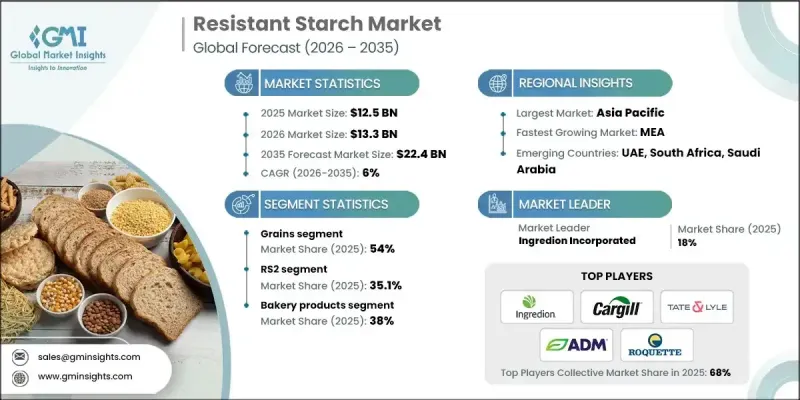
The Global Resistant Starch Market was valued at USD 12.5 billion in 2025 and is estimated to grow at a CAGR of 6% to reach USD 22.4 billion by 2035.
Market growth has been strongly influenced by rising rates of metabolic health conditions, which have prompted food producers to redesign formulations with improved nutritional profiles. Resistant starch has gained attention as it allows manufacturers to enhance fiber content and reduce glycemic impact while maintaining the familiar taste and texture of everyday food products. Its functional benefits related to digestive wellness, prolonged satiety, and blood sugar moderation have increased its use across multiple food categories. Between 2021 and 2025, raw material availability and processing efficiency supported large-scale production, particularly from widely cultivated crops. At the same time, producers explored alternative raw material streams to align with sustainability goals and clean-label positioning. Different types of resistant starch gained traction based on functional suitability, with naturally occurring and retrograded variants receiving stronger market acceptance compared to chemically modified options. These combined trends continue to support broad adoption across global food and nutrition markets.
| Market Scope | |
|---|---|
| Start Year | 2025 |
| Forecast Year | 2026-2035 |
| Start Value | $12.5 Billion |
| Forecast Value | $22.4 Billion |
| CAGR | 6% |
The grains segment accounted for 54% share in 2025 and is expected to grow at a CAGR of 5.1% through 2035. Demand is being driven by preference for familiar crop sources and regional availability, particularly in Asia Pacific markets. Grain- and vegetable-derived resistant starches are also gaining attention for their suitability in clean-label, non-GMO, and functional food applications.
The bakery products segment held 38% share in 2025 and is projected to grow at a CAGR of 6% through 2035. Resistant starch is increasingly incorporated into everyday food products to subtly improve nutritional value by lowering net carbohydrates and enhancing digestive benefits without altering consumer experience.
US Resistant Starch Market reached USD 3.2 billion in 2025. Strong innovation capabilities, advanced research infrastructure, and efficient retail distribution support the rapid commercialization of fiber-enriched and low-glycemic food products.
Key companies operating in the Global Resistant Starch Market include Cargill, Ingredion Incorporated, Tate & Lyle, Roquette Freres, ADM, SunOpta, AGRANA Beteiligungs, MGP Ingredients Inc., Arcadia Biosciences, Xian Kono Chem, MSPrebiotics, Sheikharr Starch Private Limited, Natural Stacks, and Gut Garden. Companies in the Global Resistant Starch Market are strengthening their competitive position through continuous investment in research, formulation science, and application-specific solutions. Many players are expanding portfolios with clean-label and naturally sourced resistant starches to meet evolving consumer expectations. Strategic collaborations with food manufacturers enable faster integration into mainstream products. Firms are also focusing on supply chain optimization and sustainable sourcing to improve efficiency and transparency.
Table of Contents
Chapter 1 Methodology & Scope
- 1.1 Market scope and definition
- 1.2 Research design
- 1.2.1 Research approach
- 1.2.2 Data collection methods
- 1.3 Data mining sources
- 1.3.1 Global
- 1.3.2 Regional/Country
- 1.4 Base estimates and calculations
- 1.4.1 Base year calculation
- 1.4.2 Key trends for market estimation
- 1.5 Primary research and validation
- 1.5.1 Primary sources
- 1.6 Forecast model
- 1.7 Research assumptions and limitations
Chapter 2 Executive Summary
- 2.1 Industry 3600 synopsis
- 2.2 Key market trends
- 2.2.1 Regional
- 2.2.2 Source / Organism Type
- 2.2.3 Product
- 2.2.4 Application
- 2.3 TAM Analysis, 2026-2035
- 2.4 CXO perspectives: Strategic imperatives
- 2.4.1 Executive decision points
- 2.4.2 Critical success factors
- 2.5 Future Outlook and Strategic Recommendations
Chapter 3 Industry Insights
- 3.1 Industry ecosystem analysis
- 3.1.1 Supplier landscape
- 3.1.2 Profit margin
- 3.1.3 Value addition at each stage
- 3.1.4 Factor affecting the value chain
- 3.1.5 Disruptions
- 3.2 Industry impact forces
- 3.2.1 Growth drivers
- 3.2.1.1 Rising diabetes and obesity prevalence
- 3.2.1.2 Clean-label and natural ingredient preference
- 3.2.1.3 Growing gut health and prebiotic awareness
- 3.2.2 Industry pitfalls and challenges
- 3.2.2.1 Higher cost versus conventional starches
- 3.2.2.2 Limited consumer awareness and understanding
- 3.2.3 Market opportunities
- 3.2.3.1 Expansion into plant-based and vegan foods
- 3.2.3.2 Use in medical and clinical nutrition
- 3.2.1 Growth drivers
- 3.3 Growth potential analysis
- 3.4 Regulatory landscape
- 3.4.1 North America
- 3.4.2 Europe
- 3.4.3 Asia Pacific
- 3.4.4 Latin America
- 3.4.5 Middle East & Africa
- 3.5 Porter's analysis
- 3.6 PESTEL analysis
- 3.7 Price trends
- 3.7.1 By region
- 3.7.2 By Product
- 3.8 Future market trends
- 3.9 Technology and Innovation landscape
- 3.9.1 Current technological trends
- 3.9.2 Emerging technologies
- 3.10 Patent Landscape
- 3.11 Trade statistics (HS code) ( Note: The trade statistics will be provided for key countries only)
- 3.11.1 Major importing countries
- 3.11.2 Major exporting countries
- 3.12 Sustainability and environmental aspects
- 3.12.1 Sustainable practices
- 3.12.2 Waste reduction strategies
- 3.12.3 Energy efficiency in production
- 3.12.4 Eco-friendly initiatives
- 3.13 Carbon footprint consideration
Chapter 4 Competitive Landscape, 2025
- 4.1 Introduction
- 4.2 Company market share analysis
- 4.2.1 By region
- 4.2.1.1 North America
- 4.2.1.2 Europe
- 4.2.1.3 Asia Pacific
- 4.2.1.4 LATAM
- 4.2.1.5 MEA
- 4.2.1 By region
- 4.3 Company matrix analysis
- 4.4 Competitive analysis of major market players
- 4.5 Competitive positioning matrix
- 4.6 Key developments
- 4.6.1 Mergers & acquisitions
- 4.6.2 Partnerships & collaborations
- 4.6.3 New Product Launches
- 4.6.4 Expansion Plans
Chapter 5 Market Estimates and Forecast, By Source / Organism Type, 2022-2035 (USD Billion) (Kilo Tons)
- 5.1 Key trends
- 5.2 Grains
- 5.2.1 Rice
- 5.2.2 Wheat
- 5.2.3 Sorghum
- 5.2.4 Sago
- 5.2.5 Other grains
- 5.3 Vegetables
- 5.3.1 Waxy corn
- 5.3.2 Tapioca
- 5.3.3 Pea
- 5.3.4 Other vegetables
- 5.4 Other sources
Chapter 6 Market Estimates and Forecast, By Product, 2022-2035 (USD Billion) (Kilo Tons)
- 6.1 Key trends
- 6.2 RS1
- 6.3 RS2
- 6.4 RS3
- 6.5 RS4
- 6.6 RS5
Chapter 7 Market Estimates and Forecast, By Application, 2022-2035 (USD Billion) (Kilo Tons)
- 7.1 Key trends
- 7.2 Dairy products
- 7.3 Bakery products
- 7.3.1 Bread
- 7.3.2 Cookies
- 7.3.3 Biscuits
- 7.3.4 Others
- 7.4 Sugar confections
- 7.4.1 Nutrition Bars
- 7.4.2 Others
- 7.5 Convenience foods
- 7.5.1 Noodles
- 7.5.2 Pasta
- 7.5.3 Breakfast Cereals
- 7.5.4 Crackers
- 7.5.5 Soup
- 7.5.6 Others
Chapter 8 Market Estimates and Forecast, By Region, 2022-2035 (USD Billion) (Kilo Tons)
- 8.1 Key trends
- 8.2 North America
- 8.2.1 U.S.
- 8.2.2 Canada
- 8.3 Europe
- 8.3.1 Germany
- 8.3.2 UK
- 8.3.3 France
- 8.3.4 Spain
- 8.3.5 Italy
- 8.3.6 Rest of Europe
- 8.4 Asia Pacific
- 8.4.1 China
- 8.4.2 India
- 8.4.3 Japan
- 8.4.4 Australia
- 8.4.5 South Korea
- 8.4.6 Rest of Asia Pacific
- 8.5 Latin America
- 8.5.1 Brazil
- 8.5.2 Mexico
- 8.5.3 Argentina
- 8.5.4 Rest of Latin America
- 8.6 Middle East and Africa
- 8.6.1 Saudi Arabia
- 8.6.2 South Africa
- 8.6.3 UAE
- 8.6.4 Rest of Middle East and Africa
Chapter 9 Company Profiles
- 9.1 Xian Kono Chem
- 9.2 SunOpta
- 9.3 MSPrebiotics
- 9.4 Sheekharr Starch Private Limited
- 9.5 AGRANA Beteiligungs
- 9.6 Natural Stacks
- 9.7 Gut Garden
- 9.8 ADM
- 9.9 Roquette Freres
- 9.10 Arcadia Biosciences
- 9.11 Tate & Lyle
- 9.12 MGP Ingredients Inc.
- 9.13 Ingredion Incorporated
- 9.14 Cargill

