
PUBLISHER: Global Market Insights Inc. | PRODUCT CODE: 1928943

PUBLISHER: Global Market Insights Inc. | PRODUCT CODE: 1928943
Gold Nanoparticles Market Opportunity, Growth Drivers, Industry Trend Analysis, and Forecast 2026 - 2035
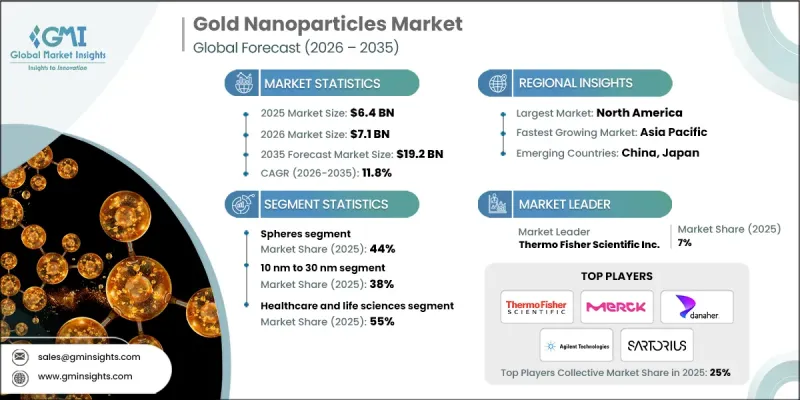
The Global Gold Nanoparticles Market was valued at USD 6.4 billion in 2025 and is estimated to grow at a CAGR of 11.8% to reach USD 19.2 billion by 2035.
Gold nanoparticles have evolved from a specialized laboratory material into a scalable, widely applied input across life sciences, addressing challenges in stable bio-labeling and tunable optical properties. Funding for life sciences research reached unprecedented levels during the COVID-19 pandemic, driving both innovation and publication output. These nanoparticles are commonly utilized as reagents and assay components in research and diagnostics. Buyers increasingly demand higher quality standards, traceability, and comprehensive documentation, particularly in in-vitro diagnostics and bioconjugation applications. ISO-aligned systems and certificates of analysis are becoming standard requirements in procurement, ensuring consistent supply chains. Sustained R&D, public science engagement, and a focus on reproducibility continue to underpin the market's long-term growth, even beyond pandemic-driven demand spikes.
| Market Scope | |
|---|---|
| Start Year | 2025 |
| Forecast Year | 2026-2035 |
| Start Value | $6.4 Billion |
| Forecast Value | $19.2 Billion |
| CAGR | 11.8% |
The spherical nanoparticles segment held a 44% share and is expected to grow at a CAGR of 11.1% through 2035. This shape dominates due to high-volume scalability, reproducibility, and ease of validation in routine labeling and assay production. Meanwhile, buyers are increasingly adding anisotropic shapes, such as rods and stars, to achieve tunable plasmonic properties for photothermal therapy and sensing applications. Suppliers are responding by broadening product catalogs and enhancing batch consistency to meet evolving research needs.
The gold nanoparticles sized 10 nm to 30 nm captured 38% share in 2025 and are expected to grow at a CAGR of 14.8% through 2035. Mid-range particles balance optical signal strength, colloidal stability, and bioconjugation practicality for routine assays. Smaller nanoparticles under 10 nm are preferred for enhanced tissue penetration and surface area, though they require stricter quality control. Larger particles remain relevant for scattering and visibility applications.
North America Gold Nanoparticles Market generated USD 2.2 billion in 2025 and is projected to reach USD 7.1 billion by 2035 at a CAGR of 12.5%. Strong life science R&D clusters, established procurement standards, and robust diagnostics demand drive regional growth. The scaling of assay manufacturing and consistent funding for translational research maintain steady demand across diagnostics, imaging, and early-stage therapeutic applications.
Major players in the Global Gold Nanoparticles Market include Cytodiagnostics Inc., nanoComposix, BBI Solutions, Merck KGaA, Thermo Fisher Scientific Inc., Danaher Corporation, Sartorius AG, Agilent Technologies, Inc., PerkinElmer, Inc., Luminex Corporation, Tanaka Precious Metals, AMETEK, Inc., Strem Chemicals, Inc., Nanopartz Inc., Meliorum Technologies, Inc., and Goldsol, Inc. Companies in the Global Gold Nanoparticles Market are strengthening their positions by expanding product portfolios with varied particle sizes and shapes to meet diverse research and diagnostic needs. R&D investments ensure improved reproducibility, stability, and bioconjugation performance. Firms are also emphasizing ISO-compliant quality systems, certificates of analysis, and traceable documentation to enhance trust with buyers.
Table of Contents
Chapter 1 Methodology & Scope
- 1.1 Market scope and definition
- 1.2 Research design
- 1.2.1 Research approach
- 1.2.2 Data collection methods
- 1.3 Data mining sources
- 1.3.1 Global
- 1.3.2 Regional/Country
- 1.4 Base estimates and calculations
- 1.4.1 Base year calculation
- 1.4.2 Key trends for market estimation
- 1.5 Primary research and validation
- 1.5.1 Primary sources
- 1.6 Forecast model
- 1.7 Research assumptions and limitations
Chapter 2 Executive Summary
- 2.1 Industry 3600 synopsis
- 2.2 Key market trends
- 2.2.1 Regional
- 2.2.2 Product
- 2.2.3 Size Range
- 2.2.4 End use Industry
- 2.3 TAM Analysis, 2026-2035
- 2.4 CXO perspectives: Strategic imperatives
- 2.4.1 Executive decision points
- 2.4.2 Critical success factors
- 2.5 Future Outlook and Strategic Recommendations
Chapter 3 Industry Insights
- 3.1 Industry ecosystem analysis
- 3.1.1 Supplier landscape
- 3.1.2 Profit margin
- 3.1.3 Value addition at each stage
- 3.1.4 Factor affecting the value chain
- 3.1.5 Disruptions
- 3.2 Industry impact forces
- 3.2.1 Growth drivers
- 3.2.1.1 Expansion of rapid diagnostics and biosensors
- 3.2.1.2 Rising nanomedicine research and translational pipelines
- 3.2.1.3 Growth in plasmonics and advanced optical devices
- 3.2.2 Industry pitfalls and challenges
- 3.2.2.1 High cost and price volatility of gold
- 3.2.2.2 Regulatory and safety validation burden
- 3.2.3 Market opportunities
- 3.2.3.1 Targeted drug delivery and photothermal therapy
- 3.2.3.2 Scalable green synthesis and surface functionalization
- 3.2.1 Growth drivers
- 3.3 Growth potential analysis
- 3.4 Regulatory landscape
- 3.4.1 North America
- 3.4.2 Europe
- 3.4.3 Asia Pacific
- 3.4.4 Latin America
- 3.4.5 Middle East & Africa
- 3.5 Porter';s analysis
- 3.6 PESTEL analysis
- 3.7 Price trends
- 3.7.1 By region
- 3.7.2 By Product type
- 3.8 Future market trends
- 3.9 Technology and Innovation landscape
- 3.9.1 Current technological trends
- 3.9.2 Emerging technologies
- 3.10 Patent Landscape
- 3.11 Trade statistics (HS code) (Note: the trade statistics will be provided for key countries only)
- 3.11.1 Major importing countries
- 3.11.2 Major exporting countries
- 3.12 Sustainability and environmental aspects
- 3.12.1 Sustainable practices
- 3.12.2 Waste reduction strategies
- 3.12.3 Energy efficiency in production
- 3.12.4 Eco-friendly initiatives
- 3.13 Carbon footprint consideration
Chapter 4 Competitive Landscape, 2025
- 4.1 Introduction
- 4.2 Company market share analysis
- 4.2.1 By region
- 4.2.1.1 North America
- 4.2.1.2 Europe
- 4.2.1.3 Asia Pacific
- 4.2.1.4 LATAM
- 4.2.1.5 MEA
- 4.2.1 By region
- 4.3 Company matrix analysis
- 4.4 Competitive analysis of major market players
- 4.5 Competitive positioning matrix
- 4.6 Key developments
- 4.6.1 Mergers & acquisitions
- 4.6.2 Partnerships & collaborations
- 4.6.3 New Product Launches
- 4.6.4 Expansion Plans
Chapter 5 Market Estimates and Forecast, By Product, 2022-2035 (USD Billion) (Kilo Tons)
- 5.1 Key trends
- 5.2 Spheres
- 5.3 Rods
- 5.4 Shells
- 5.5 Cages
- 5.6 Stars
- 5.7 Triangles and prisms
- 5.8 Other
Chapter 6 Market Estimates and Forecast, By Size Range, 2022-2035 (USD Billion) (Kilo Tons)
- 6.1 Key trends
- 6.2 Less than 10 nm
- 6.3 10 nm to 30 nm
- 6.4 31 nm to 50 nm
- 6.5 51 nm to 100 nm
- 6.6 More than 100 nm
Chapter 7 Market Estimates and Forecast, By End Use Industry, 2022-2035 (USD Billion) (Kilo Tons)
- 7.1 Key trends
- 7.2 Healthcare and life sciences
- 7.2.1 In vitro diagnostics
- 7.2.2 Imaging and contrast agents
- 7.2.3 Drug delivery and therapeutics
- 7.2.4 Biosensors
- 7.2.5 Research and laboratory use
- 7.3 Electronics and photonics
- 7.3.1 Conductive inks
- 7.3.2 Displays and optoelectronics
- 7.3.3 Plasmonic devices
- 7.3.4 Photothermal and optical components
- 7.4 Chemicals and materials
- 7.4.1 Catalysts
- 7.4.2 Coatings and composites
- 7.5 Energy and environment
- 7.5.1 Solar and fuel cell applications
- 7.5.2 Water treatment and environmental sensing
- 7.6 Other end use
Chapter 8 Market Estimates and Forecast, By Region, 2022-2035 (USD Billion) (Kilo Tons)
- 8.1 Key trends
- 8.2 North America
- 8.2.1 U.S.
- 8.2.2 Canada
- 8.3 Europe
- 8.3.1 Germany
- 8.3.2 UK
- 8.3.3 France
- 8.3.4 Spain
- 8.3.5 Italy
- 8.3.6 Rest of Europe
- 8.4 Asia Pacific
- 8.4.1 China
- 8.4.2 India
- 8.4.3 Japan
- 8.4.4 Australia
- 8.4.5 South Korea
- 8.4.6 Rest of Asia Pacific
- 8.5 Latin America
- 8.5.1 Brazil
- 8.5.2 Mexico
- 8.5.3 Argentina
- 8.5.4 Rest of Latin America
- 8.6 Middle East and Africa
- 8.6.1 Saudi Arabia
- 8.6.2 South Africa
- 8.6.3 UAE
- 8.6.4 Rest of Middle East and Africa
Chapter 9 Company Profiles
- 9.1 Cytodiagnostics Inc.
- 9.2 nanoComposix
- 9.3 BBI Solutions
- 9.4 Merck KGaA
- 9.5 Thermo Fisher Scientific Inc.
- 9.6 Danaher Corporation
- 9.7 Sartorius AG
- 9.8 Agilent Technologies Inc.
- 9.9 PerkinElmer Inc.
- 9.10 Luminex Corporation
- 9.11 Tanaka Precious Metals
- 9.12 AMETEK Inc.
- 9.13 Strem Chemicals Inc.
- 9.14 Nanopartz Inc.
- 9.15 Meliorum Technologies Inc.
- 9.16 Goldsol Inc.

