
PUBLISHER: Global Market Insights Inc. | PRODUCT CODE: 1936510

PUBLISHER: Global Market Insights Inc. | PRODUCT CODE: 1936510
SDV-as-a-Service (SDVaaS) Platform Market Opportunity, Growth Drivers, Industry Trend Analysis, and Forecast 2026 - 2035
The Global SDV-as-a-Service Platform Market was valued at USD 8.2 billion in 2025 and is estimated to grow at a CAGR of 26.3% to reach USD 85.7 billion by 2035.
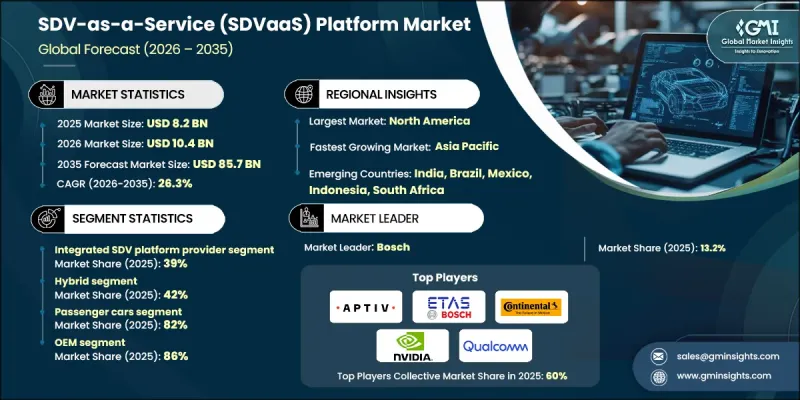
Market growth directly links to rising consumer demand for smartphone-style vehicle experiences, frequent software enhancements, and highly personalized mobility features. Automakers actively respond by adopting cloud-enabled software platforms that support over-the-air updates, digital feature activation, and subscription-based services, allowing vehicles to evolve well after purchase. Vehicles increasingly function as software-defined products rather than static machines, enabling continuous value creation across the ownership lifecycle. This transformation reshapes revenue models, strengthens customer engagement, and expands post-sale monetization opportunities. OEMs rely on SDVaaS platforms to deliver scalable digital ecosystems that connect vehicles, drivers, and cloud services in real time. As expectations for seamless connectivity and intelligent features rise, SDVaaS becomes a foundational element in next-generation vehicle strategies across passenger and commercial segments worldwide.
| Market Scope | |
|---|---|
| Start Year | 2025 |
| Forecast Year | 2026-2035 |
| Start Value | $8.2 Billion |
| Forecast Value | $85.7 Billion |
| CAGR | 26.3% |
Automakers actively transition from distributed ECU structures to centralized computing supported by zonal electronic and electrical architectures. This architectural shift creates the technical foundation required for SDVaaS business models while simplifying vehicle wiring, improving system efficiency, and enabling unified service delivery across multiple platforms. Centralized and zonal designs allow software reuse, faster deployment of new features, and easier scalability across different vehicle lines. OEMs increasingly collaborate with cloud providers, AI developers, and technology companies to accelerate SDV platform maturity. These partnerships provide advanced analytics, high-performance computing, and secure cloud interfaces that shorten development timelines and support remote product creation, deployment, maintenance, and lifecycle management. SDVaaS platforms empower automakers to deliver richer digital experiences and maintain continuous interaction with customers throughout the vehicle lifespan.
The integrated SDV platform segment held 39% share in 2025 and will grow at a CAGR of 27% from 2026 to 2035. These providers dominate because they deliver comprehensive, end-to-end solutions that combine vehicle cloud infrastructure, operating systems, and application layers into unified platforms. Such integration supports large-scale OTA updates and enables dynamic service deployment across multiple vehicle models and product portfolios. By offering complete ecosystems rather than isolated tools, integrated providers simplify adoption for OEMs and accelerate the transition toward fully software-defined vehicles while ensuring consistency, security, and scalability across global fleets.
The hybrid deployment model segment held a 42% share in 2025 and is expected to grow at a CAGR of 27.3% through 2035. Hybrid SDVaaS deployments blend on-premises infrastructure with private and public cloud environments, giving enterprises greater operational flexibility and cost control. Automakers manage sensitive workloads locally while leveraging cloud scalability for data processing, analytics, and feature expansion. This approach allows precise cost optimization while meeting regulatory, performance, and security requirements. Hybrid deployments support phased SDV rollouts and enable OEMs to balance innovation speed with infrastructure stability as vehicle software complexity increases.
US SDV-as-a-Service Platform Market reached USD 2.62 billion in 2025. The US maintains leadership in SDV adoption due to strong collaboration between major automakers and technology firms, particularly within innovation hubs that advance connected vehicle infrastructure, OTA capabilities, V2X communication, and autonomous systems. Federal support strengthens this position through policies that encourage autonomous vehicle testing and connected mobility initiatives. These measures boost research investments and enable real-world validation of advanced SDV technologies across highways, smart corridors, and urban environments, positioning the US as a global center for SDV innovation and deployment.
Key players active in the Global SDV-as-a-Service Platform Market include NVIDIA, Bosch, Amazon Web Services, Qualcomm Technologies, Google, Continental, Microsoft, BlackBerry QNX, Vector Informatik, and Aptiv. Companies operating in the SDV-as-a-Service Platform Market strengthen their foothold by investing heavily in end-to-end software ecosystems, cloud-native architectures, and scalable computing platforms. Strategic alliances with automakers, semiconductor firms, and AI developers help providers expand technical capabilities and accelerate deployment timelines. Vendors focus on modular platform designs that allow OEMs to customize features while maintaining core system stability. Continuous innovation in cybersecurity, data analytics, and real-time vehicle intelligence remains central to competitive positioning.
Table of Contents
Chapter 1 Methodology
- 1.1 Research approach
- 1.2 Quality commitments
- 1.3 GMI AI policy & data integrity commitment
- 1.4 Research trail & confidence scoring
- 1.4.1 Research trail components
- 1.4.2 Scoring components
- 1.5 Data collection
- 1.5.1 Partial list of primary sources
- 1.6 Data mining sources
- 1.6.1 Paid sources
- 1.7 Base estimates and calculations
- 1.7.1 Base year calculation
- 1.8 Forecast model
- 1.9 Research transparency addendum
Chapter 2 Executive Summary
- 2.1 Industry 360° synopsis
- 2.2 Key market trends
- 2.2.1 Regional
- 2.2.2 Platform
- 2.2.3 Vehicle
- 2.2.4 Application
- 2.2.5 Deployment model
- 2.2.6 End use
- 2.3 TAM analysis, 2026-2035
- 2.4 CXO perspectives: Strategic imperatives
- 2.4.1 Executive decision points
- 2.4.2 Critical success factors
- 2.5 Future outlook
- 2.6 Strategic recommendations
Chapter 3 Industry Insights
- 3.1 Industry ecosystem analysis
- 3.1.1 Supplier landscape
- 3.1.2 Profit margin
- 3.1.3 Cost structure
- 3.1.4 Value addition at each stage
- 3.1.5 Factor affecting the value chain
- 3.1.6 Disruptions
- 3.2 Industry impact forces
- 3.2.1 Growth drivers
- 3.2.1.1 Consumer demand for personalization
- 3.2.1.2 Centralized E/E architectures adoption
- 3.2.1.3 OEM-tech partnerships expansion
- 3.2.1.4 Regulatory-driven secure OTA
- 3.2.2 Industry pitfalls and challenges
- 3.2.2.1 Cybersecurity and privacy risks
- 3.2.2.2 Fragmented cross-brand standards
- 3.2.3 Market opportunities
- 3.2.3.1 Subscription-based platform revenues
- 3.2.3.2 OEM-cloud strategic alliances
- 3.2.3.3 Third-party developer ecosystems
- 3.2.3.4 Data-driven mobility services
- 3.2.1 Growth drivers
- 3.3 Growth potential analysis
- 3.4 Regulatory landscape
- 3.4.1 North America
- 3.4.1.1 U.S. Department of Transportation (DOT) Standards
- 3.4.1.2 Occupational Safety and Health Administration (OSHA) Guidelines
- 3.4.1.3 U.S. Environmental Protection Agency (EPA)
- 3.4.2 Europe
- 3.4.2.1 EN ISO Container Standards
- 3.4.2.2 European Union Customs and Safety Regulations
- 3.4.2.3 BS EN / CEN Standards
- 3.4.2.4 National Standards (UNE, DIN, etc.)
- 3.4.3 Asia Pacific
- 3.4.3.1 China GB (Guobiao) Standards
- 3.4.3.2 Japan JIS Requirements
- 3.4.3.3 Korea KS Certification
- 3.4.3.4 Indian BIS Standards
- 3.4.3.5 Thai Industrial Standards Institute (TISI)
- 3.4.4 Latin America
- 3.4.4.1 INMETRO (National Institute of Metrology)
- 3.4.4.2 INTI certification (Instituto Nacional de Tecnologia Industrial)
- 3.4.4.3 NOM standards (Norma Official Mexicana)
- 3.4.5 Middle East & Africa
- 3.4.5.1 ESMA / Emirates Conformity Assessment Scheme (ECAS)
- 3.4.5.2 GCC technical regulations
- 3.4.5.3 SABS certification
- 3.4.1 North America
- 3.5 Porter's analysis
- 3.6 PESTEL analysis
- 3.7 Technology and innovation landscape
- 3.7.1 Current technological trends
- 3.7.2 Emerging technologies
- 3.8 Cost breakdown analysis
- 3.8.1 Vendor cost structure
- 3.8.2 Implementation of cost components
- 3.8.3 Ongoing operational costs
- 3.8.4 Indirect customer costs
- 3.9 Patent analysis
- 3.10 Sustainability and environmental aspects
- 3.10.1 Sustainable practices
- 3.10.2 Waste reduction strategies
- 3.10.3 Energy efficiency in production
- 3.10.4 Eco-friendly initiatives
- 3.10.5 Carbon footprint considerations
- 3.11 Use cases
- 3.12 Business & Monetization models
- 3.12.1 SDVaaS business model landscape
- 3.12.2 Platform licensing & subscription models
- 3.12.3 Usage-based & consumption pricing models
- 3.12.4 Development-as-a-service (DaaS) models
- 3.12.5 Revenue sharing & partnership models
- 3.13 Buyer decision criteria & procurement behavior
- 3.13.1 Buyer landscape overview
- 3.13.2 Decision-making process analysis
- 3.13.3 Critical evaluation criteria
- 3.13.4 Vendor selection & RFP process
- 3.13.5 Negotiation dynamics
Chapter 4 Competitive Landscape, 2025
- 4.1 Introduction
- 4.2 Company market share analysis
- 4.2.1 North America
- 4.2.2 Europe
- 4.2.3 Asia Pacific
- 4.2.4 LATAM
- 4.2.5 MEA
- 4.3 Competitive analysis of major market players
- 4.4 Competitive positioning matrix
- 4.5 Strategic outlook matrix
- 4.6 Key developments
- 4.6.1 Mergers & acquisitions
- 4.6.2 Partnerships & collaborations
- 4.6.3 New product launches
- 4.6.4 Expansion plans and funding
Chapter 5 Market Estimates & Forecast, By Platform, 2022 - 2035 ($Mn)
- 5.1 Key trends
- 5.2 Integrated SDV platform provider
- 5.3 Domain solution provider
- 5.4 Component specialist platform
- 5.5 Design & development as a service
- 5.6 Software operations as a service
Chapter 6 Market Estimates & Forecast, By Vehicle, 2022 - 2035 ($Mn)
- 6.1 Key trends
- 6.2 Passenger cars
- 6.2.1 Hatchback
- 6.2.2 Sedan
- 6.2.3 SUV
- 6.3 Commercial vehicle
- 6.3.1 LCV (Light commercial vehicle)
- 6.3.2 MCV (Medium commercial vehicle)
- 6.3.3 HCV (Heavy commercial vehicle)
Chapter 7 Market Estimates & Forecast, By Application, 2022 - 2035 ($Mn)
- 7.1 Key trends
- 7.2 ADAS & autonomous driving platforms
- 7.3 Operating system & middleware platforms
- 7.4 Infotainment & connectivity platforms
- 7.5 Vehicle efficiency & performance platforms
- 7.6 Safety, security & functional safety platforms
Chapter 8 Market Estimates & Forecast, By Deployment model, 2022 - 2035 ($Mn)
- 8.1 Key trends
- 8.2 On-Premises
- 8.3 Private Cloud
- 8.4 Public Cloud
- 8.5 Hybrid
Chapter 9 Market Estimates & Forecast, By End use, 2022 - 2035 ($Mn)
- 9.1 Key trends
- 9.2 Tech-native & SDV-first OEMs
- 9.3 Legacy automotive OEMs
- 9.4 Tier-1 & tier-2 automotive suppliers
- 9.5 Automotive software & technology providers
- 9.6 Semiconductor & computing platform providers
Chapter 10 Market Estimates & Forecast, By Region, 2022 - 2035 ($Mn)
- 10.1 Key trends
- 10.2 North America
- 10.2.1 US
- 10.2.2 Canada
- 10.3 Europe
- 10.3.1 Germany
- 10.3.2 UK
- 10.3.3 France
- 10.3.4 Italy
- 10.3.5 Spain
- 10.3.6 Nordics
- 10.3.7 Russia
- 10.3.8 Poland
- 10.3.9 Romania
- 10.4 Asia Pacific
- 10.4.1 China
- 10.4.2 India
- 10.4.3 Japan
- 10.4.4 South Korea
- 10.4.5 ANZ
- 10.4.6 Vietnam
- 10.4.7 Indonesia
- 10.5 Latin America
- 10.5.1 Brazil
- 10.5.2 Mexico
- 10.5.3 Argentina
- 10.6 MEA
- 10.6.1 South Africa
- 10.6.2 Saudi Arabia
- 10.6.3 UAE
Chapter 11 Company Profiles
- 11.1 Global companies
- 11.1.1 Amazon Web Services (AWS)
- 11.1.2 Aptiv
- 11.1.3 ARM
- 11.1.4 BlackBerry
- 11.1.5 Continental
- 11.1.6 Google
- 11.1.7 Microsoft
- 11.1.8 NVIDIA
- 11.1.9 Qualcomm
- 11.1.10 Robert Bosch
- 11.2 Regional players
- 11.2.1 Elektrobit Automotive
- 11.2.2 ETAS
- 11.2.3 HERE Technologies
- 11.2.4 Infineon Technologies
- 11.2.5 NXP Semiconductors
- 11.2.6 Red Hat
- 11.2.7 Renesas Electronics
- 11.2.8 STMicroelectronics
- 11.2.9 TTTech Auto
- 11.2.10 Visteon
- 11.3 Emerging players
- 11.3.1 Aurora Innovation
- 11.3.2 Canoo
- 11.3.3 Motional
- 11.3.4 Sonatus
- 11.3.5 Woven by Toyota

