
PUBLISHER: Global Market Insights Inc. | PRODUCT CODE: 1936590

PUBLISHER: Global Market Insights Inc. | PRODUCT CODE: 1936590
Heavy Duty Gas Turbine Market Opportunity, Growth Drivers, Industry Trend Analysis, and Forecast 2026 - 2035
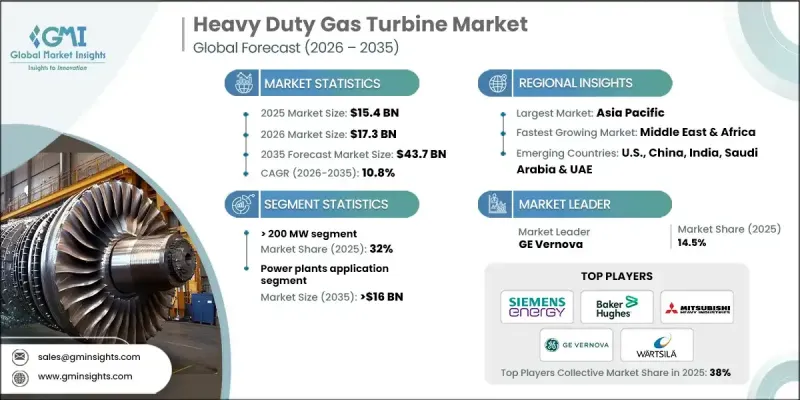
The Global Heavy Duty Gas Turbine Market was valued at USD 15.4 billion in 2025 and is estimated to grow at a CAGR of 10.8% to reach USD 43.7 billion by 2035.
Rising global electricity consumption, combined with the gradual shift toward lower-emission power generation, continues to support demand for advanced gas turbine solutions. Governments and power producers increasingly rely on gas-based generation as a transitional energy source while upgrading aging infrastructure and improving grid performance. Heavy duty gas turbines represent highly engineered power systems developed to deliver consistent output, high availability, and long operational life. These turbines are designed to maximize thermal performance through advanced system integration, refined combustion control, and precision-driven aerodynamic design. They operate reliably under demanding conditions while providing the operational flexibility required to respond to fluctuating grid loads. Their ability to accommodate multiple fuel pathways further strengthens their relevance within evolving energy strategies. As power systems become more efficiency-driven and performance-focused, heavy duty gas turbines remain central to modern power generation investments, supporting both energy security and long-term sustainability goals.
| Market Scope | |
|---|---|
| Start Year | 2025 |
| Forecast Year | 2026-2035 |
| Start Value | $15.4 Billion |
| Forecast Value | $43.7 Billion |
| CAGR | 10.8% |
The segment rated above 200 MW accounted for 32% share in 2025 and is expected to grow at a CAGR of 10.5% through 2035. Growth in this segment is supported by rising power demand, stricter efficiency expectations, and long-term decarbonization objectives. Utilities increasingly favor large-capacity turbines that offer operational flexibility, improved output efficiency, and enhanced system optimization while maintaining compliance with evolving environmental requirements.
The oil & gas heavy duty gas turbine segment generated USD 2.3 billion in 2025. These turbines play a critical role across energy production, transportation, and processing operations by supporting continuous mechanical drive and power generation needs. Demand remains strong due to the requirement for dependable performance in remote locations and challenging operating environments. Operators emphasize durability, extended service intervals, consistent efficiency under continuous operation, and adherence to increasingly stringent emissions regulations.
US Heavy Duty Gas Turbine Market accounted for 74% share and generated USD 2.6 billion in 2025. Market growth is supported by increasing electricity requirements, infrastructure upgrades, and long-term emissions reduction targets. Utilities continue to invest in high-efficiency power generation assets that offer operational flexibility, grid stability, and cost-effective performance, reinforcing the country's leadership position within the regional market.
Major companies operating in the Global Heavy Duty Gas Turbine Market include Siemens Energy, Mitsubishi Heavy Industries, GE Vernova, Ansaldo Energia, Baker Hughes, Rolls Royce, Wartsila, MAN Energy Solutions, Doosan Enerbility, Kawasaki Heavy Industries, Shanghai Electric Gas Turbine, Harbin Electric, Bharat Heavy Electricals, Solar Turbines, Vericor, Ethos Energy Group, Flex Energy Solutions, Centrax Gas Turbines, Boldrocchi, Nanjing Steam Turbine Motor, Capstone Green Energy, and Destinus Energy. Companies operating in the heavy duty gas turbine market focus on strengthening their market position through continuous performance improvement, lifecycle optimization, and technology differentiation. Many invest heavily in efficiency enhancement, emissions reduction capabilities, and long-term reliability to meet evolving utility and industrial requirements. Strategic partnerships with utilities and energy developers support early-stage project integration and recurring service contracts. Firms also prioritize digitalization to improve asset monitoring, maintenance planning, and operational transparency.
Table of Contents
Chapter 1 Methodology & Scope
- 1.1 Research approach
- 1.2 Quality commitments
- 1.2.1 GMI AI policy & data integrity commitment
- 1.2.1.1 Source consistency protocol
- 1.2.1 GMI AI policy & data integrity commitment
- 1.3 Research trail & confidence scoring
- 1.3.1 Research trail components
- 1.3.2 Scoring components
- 1.4 Data collection
- 1.4.1 Partial list of primary sources
- 1.5 Data mining sources
- 1.5.1 Paid sources
- 1.5.1.1 Sources, by region
- 1.5.1 Paid sources
- 1.6 Base estimates and calculations
- 1.6.1 Base year calculation for any one approach
- 1.7 Market estimates & forecasts parameters
- 1.8 Forecast model
- 1.8.1 Quantified market impact analysis
- 1.8.1.1 Mathematical impact of growth parameters on forecast
- 1.8.1 Quantified market impact analysis
- 1.9 Research transparency addendum
- 1.9.1 Source attribution framework
- 1.9.2 Quality assurance metrics
- 1.9.3 Our commitment to trust
- 1.10 Market definitions
Chapter 2 Executive Summary
- 2.1 Industry synopsis, 2022 - 2035
- 2.1.1 Business trends
- 2.1.2 Capacity trends
- 2.1.3 Technology trends
- 2.1.4 Application trends
- 2.1.5 Regional trends
Chapter 3 Industry Insights
- 3.1 Industry ecosystem analysis
- 3.1.1 Raw material availability & sourcing analysis
- 3.1.2 Manufacturing capacity assessment
- 3.1.3 Supply chain resilience & risk factors
- 3.1.4 Distribution network analysis
- 3.2 Regulatory landscape
- 3.3 Industry impact forces
- 3.3.1 Growth drivers
- 3.3.2 Industry pitfalls & challenges
- 3.4 Growth potential analysis
- 3.5 Porter's analysis
- 3.5.1 Bargaining power of suppliers
- 3.5.2 Bargaining power of buyers
- 3.5.3 Threat of new entrants
- 3.5.4 Threat of substitutes
- 3.6 PESTEL analysis
- 3.6.1 Political factors
- 3.6.2 Economic factors
- 3.6.3 Social factors
- 3.6.4 Technological factors
- 3.6.5 Legal factors
- 3.6.6 Environmental factors
- 3.7 Cost structure analysis of heavy duty gas turbines
- 3.8 Price trend analysis (USD/MW)
- 3.8.1 By region
- 3.8.2 By capacity
- 3.9 Emerging opportunities & technological trends
- 3.10 Investment landscape & future prospects
- 3.11 Digital transformation & industry 4.0 integration
- 3.12 Sustainability initiatives & decarbonization strategies
Chapter 4 Competitive Landscape, 2026
- 4.1 Introduction
- 4.2 Company market share analysis, by region, 2025
- 4.2.1 North America
- 4.2.2 Europe
- 4.2.3 Asia Pacific
- 4.2.4 Middle East & Africa
- 4.2.5 Latin America
- 4.3 Strategic dashboard
- 4.4 Strategic initiatives
- 4.4.1 Key partnerships & collaborations
- 4.4.2 Major M&A activities
- 4.4.3 Product innovations & launches
- 4.4.4 Market expansion strategies
- 4.5 Competitive benchmarking
- 4.6 Innovation & sustainability landscape
Chapter 5 Market Size and Forecast, By Capacity, 2022 - 2035 (USD Million & MW)
- 5.1 Key trends
- 5.2 ≤ 50 kW
- 5.3 > 50 kW to 500 kW
- 5.4 > 500 kW to 1 MW
- 5.5 > 1 MW to 30 MW
- 5.6 > 30 MW to 70 MW
- 5.7 > 70 MW to 200 MW
- 5.8 > 200 MW
Chapter 6 Market Size and Forecast, By Technology, 2022 - 2035 (USD Million & MW)
- 6.1 Key trends
- 6.2 Open cycle
- 6.3 Combined cycle
Chapter 7 Market Size and Forecast, By Application, 2022 - 2035 (USD Million & MW)
- 7.1 Key trends
- 7.2 Power plants
- 7.3 Oil & gas
- 7.4 Process plants
- 7.5 Aviation
- 7.6 Marine
- 7.7 Others
Chapter 8 Market Size and Forecast, By Region, 2022 - 2035 (USD Million & MW)
- 8.1 Key trends
- 8.2 North America
- 8.2.1 U.S.
- 8.2.2 Canada
- 8.2.3 Mexico
- 8.3 Europe
- 8.3.1 UK
- 8.3.2 France
- 8.3.3 Germany
- 8.3.4 Russia
- 8.3.5 Italy
- 8.3.6 Netherlands
- 8.3.7 Finland
- 8.3.8 Greece
- 8.3.9 Denmark
- 8.3.10 Romania
- 8.3.11 Poland
- 8.3.12 Sweden
- 8.4 Asia Pacific
- 8.4.1 China
- 8.4.2 Australia
- 8.4.3 Japan
- 8.4.4 India
- 8.4.5 South Korea
- 8.4.6 Indonesia
- 8.4.7 Thailand
- 8.4.8 Malaysia
- 8.4.9 Bangladesh
- 8.5 Middle East & Africa
- 8.5.1 Saudi Arabia
- 8.5.2 UAE
- 8.5.3 Qatar
- 8.5.4 Kuwait
- 8.5.5 Oman
- 8.5.6 Egypt
- 8.5.7 Turkey
- 8.5.8 Bahrain
- 8.5.9 Iraq
- 8.5.10 Jordan
- 8.5.11 Lebanon
- 8.5.12 South Africa
- 8.5.13 Nigeria
- 8.5.14 Algeria
- 8.5.15 Kenya
- 8.5.16 Ghana
- 8.6 Latin America
- 8.6.1 Brazil
- 8.6.2 Argentina
- 8.6.3 Peru
Chapter 9 Company Profiles
- 9.1 Ansaldo Energia
- 9.2 Baker Hughes
- 9.3 Boldrocchi
- 9.4 Bharat Heavy Electricals
- 9.5 Capstone Green Energy
- 9.6 Centrax Gas Turbines
- 9.7 Destinus Energy
- 9.8 Doosan Enerbility
- 9.9 Ethos Energy Group
- 9.10 Flex Energy Solutions
- 9.11 GE Vernova
- 9.12 Harbin Electric
- 9.13 Kawasaki Heavy Industries
- 9.14 MAN Energy Solutions
- 9.15 Mitsubishi Heavy Industries
- 9.16 Nanjing Steam Turbine Motor
- 9.17 Rolls Royce
- 9.18 Siemens Energy
- 9.19 Shanghai Electric Gas Turbine
- 9.20 Solar Turbines
- 9.21 Vericor
- 9.22 Wartsila

