
PUBLISHER: Global Market Insights Inc. | PRODUCT CODE: 1936673

PUBLISHER: Global Market Insights Inc. | PRODUCT CODE: 1936673
Underwater Connectors Market Opportunity, Growth Drivers, Industry Trend Analysis, and Forecast 2026 - 2035
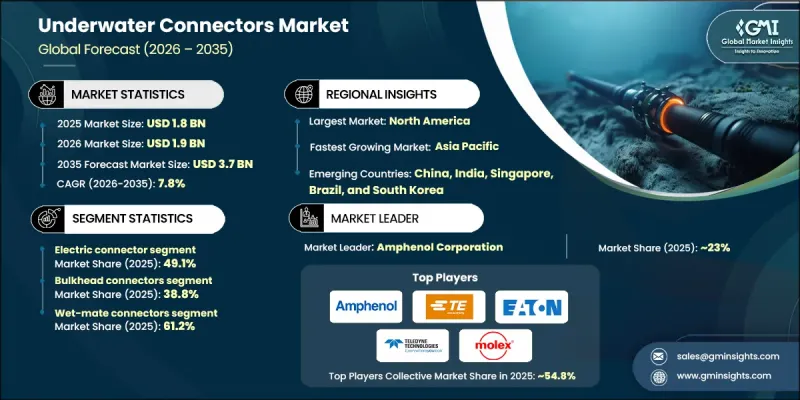
The Global Underwater Connectors Market was valued at USD 1.8 billion in 2025 and is estimated to grow at a CAGR of 7.8% to reach USD 3.7 billion by 2035.
Market expansion is driven by rising offshore oil and gas exploration, the deployment of subsea power and communication networks, and increased utilization of remotely operated vehicles (ROVs) and autonomous underwater vehicles (AUVs). A widening customer base, including energy operators, defense programs, telecom consortia, ocean research institutions, and emerging underwater data-center operators, is driving demand for connectors that meet unique voltage, depth, and reliability standards. Both wet-mate and dry-mate connectors are increasingly sought after for offshore energy projects, undersea fiber routes, and high-voltage wind interconnections. Rising fiber-optic infrastructure investments to support AI-driven traffic, denser optical networks, and modular serviceable subsea systems further amplify demand, positioning underwater connectors as critical components in the evolving subsea ecosystem.
| Market Scope | |
|---|---|
| Start Year | 2025 |
| Forecast Year | 2026-2035 |
| Start Value | $1.8 Billion |
| Forecast Value | $3.7 Billion |
| CAGR | 7.8% |
The electric connector segment captured 49.1% share in 2025. Subsea hubs, deepwater oil and gas systems, inspection-class robotics, and offshore wind installations rely on robust, ruggedized electrical connectors. Strong offshore activity in the U.S. is boosting investment in subsea power infrastructure, solidifying electric connectors as a leading segment while high-voltage dry-mate assemblies gain traction in floating wind and grid-tie systems.
The bulkhead connectors segment held a 38.8% share in 2025. Bulkhead connectors are essential for providing reliable power and data feedthroughs across subsea housing and control module boundaries. Manufacturers are focusing on corrosion-resistant, high-performance bulkhead designs with improved sealing, high power densities, and high data rates to meet evolving subsea requirements.
North America Underwater Connectors Market held a 38.6% share in 2025. Growth in the region is fueled by increasing submarine cable deployment, offshore wind projects, and investments in defense and energy programs, along with regulatory support and technological innovation in subsea systems.
Key players in the Global Underwater Connectors Market include TE Connectivity, Amphenol Corp., MacArtney, Fischer Connectors, Smiths Group Plc, Molex, Glenair Inc., Baker Hughes (GE Company LLC), Eaton Corporation, Hydro Group, and Teledyne. Companies in the underwater connectors market strengthen their positions through several strategic initiatives. They invest in R&D to enhance corrosion resistance, high-pressure tolerance, and multi-signal compatibility. Collaboration with energy, defense, and telecom clients ensures custom solutions for subsea projects. Firms expand manufacturing and service facilities near offshore hubs to improve delivery efficiency. Adoption of modular, serviceable designs and standardization across subsea platforms increases compatibility and reduces maintenance downtime. Strategic acquisitions and partnerships help broaden geographic reach, enhance product portfolios, and maintain competitive advantages in an increasingly complex and technologically demanding market.
Table of Contents
Chapter 1 Methodology and Scope
- 1.1 Market scope and definition
- 1.2 Research design
- 1.2.1 Research approach
- 1.2.2 Data collection methods
- 1.3 Data mining sources
- 1.3.1 Global
- 1.3.2 Regional/Country
- 1.4 Base estimates and calculations
- 1.4.1 Base year calculation
- 1.4.2 Key trends for market estimation
- 1.5 Primary research and validation
- 1.5.1 Primary sources
- 1.6 Forecast model
- 1.7 Research assumptions and limitations
Chapter 2 Executive summary
- 2.1 Industry 3600 synopsis
- 2.2 Key market trends
- 2.2.1 Product type trends
- 2.2.2 Mechanical structure trends
- 2.2.3 Mating methods trends
- 2.2.4 Material type trends
- 2.2.5 Connector shape trends
- 2.2.6 Depth rating trends
- 2.2.7 Voltage rating trends
- 2.2.8 Application trends
- 2.2.9 Regional trends
- 2.3 TAM Analysis, 2026-2035 (USD Million)
- 2.4 CXO perspectives: Strategic imperatives
- 2.4.1 Executive decision points
- 2.4.2 critical success factors
- 2.5 Future outlook and strategic recommendations
Chapter 3 Industry insights
- 3.1 Industry ecosystem analysis
- 3.1.1 Supplier landscape
- 3.1.2 Profit margin
- 3.1.3 Cost structure
- 3.1.4 Value addition at each stage
- 3.1.5 Factor affecting the value chain
- 3.1.6 Disruptions
- 3.2 Industry ecosystem analysis
- 3.3 Industry impact forces
- 3.3.1 Growth drivers
- 3.3.1.1 Rising offshore oil & gas deepwater operations
- 3.3.1.2 Expansion in subsea telecommunications infrastructure
- 3.3.1.3 Growth in offshore renewable energy integration & grid
- 3.3.1.4 Advancements in connector materials and sealing technologies
- 3.3.2 Pitfalls and challenges
- 3.3.2.1 High development and manufacturing costs
- 3.3.2.2 Complexities in sealing and high-voltage wet-mate connectors
- 3.3.3 Market opportunities
- 3.3.3.1 Advancements in connector materials and sealing technologies
- 3.3.3.2 Increasing adoption of remotely operated vehicles (ROVs)
- 3.3.1 Growth drivers
- 3.4 Growth potential analysis
- 3.5 Regulatory landscape
- 3.5.1 North America
- 3.5.2 Europe
- 3.5.3 Asia Pacific
- 3.5.4 Latin America
- 3.5.5 Middle East & Africa
- 3.6 Porter's analysis
- 3.7 PESTEL analysis
- 3.8 Technology and Innovation landscape
- 3.8.1 Current technological trends
- 3.8.2 Emerging technologies
- 3.9 Emerging Business Models
- 3.10 Compliance Requirements
- 3.11 Sustainability Measures
- 3.12 Consumer Sentiment Analysis
- 3.13 Patent and IP analysis
- 3.14 Geopolitical and trade dynamics
Chapter 4 Competitive landscape, 2025
- 4.1 Introduction
- 4.2 Company market share analysis
- 4.2.1 By region
- 4.2.1.1 North America
- 4.2.1.2 Europe
- 4.2.1.3 Asia Pacific
- 4.2.1.4 Latin America
- 4.2.1.5 Middle East & Africa
- 4.2.2 Market concentration analysis
- 4.2.1 By region
- 4.3 Competitive benchmarking of key players
- 4.3.1 Financial performance comparison
- 4.3.1.1 Revenue
- 4.3.1.2 Profit margin
- 4.3.1.3 R&D
- 4.3.2 Product portfolio comparison
- 4.3.2.1 Product range breadth
- 4.3.2.2 Technology
- 4.3.2.3 Innovation
- 4.3.3 Geographic presence comparison
- 4.3.3.1 Global footprint analysis
- 4.3.3.2 Service network coverage
- 4.3.3.3 Market penetration by region
- 4.3.4 Competitive positioning matrix
- 4.3.4.1 Leaders
- 4.3.4.2 Challengers
- 4.3.4.3 Followers
- 4.3.4.4 Niche players
- 4.3.5 Strategic outlook matrix
- 4.3.1 Financial performance comparison
- 4.4 Key developments, 2021-2024
- 4.4.1 Mergers and acquisitions
- 4.4.2 Partnerships and collaborations
- 4.4.3 Technological advancements
- 4.4.4 Expansion and investment strategies
- 4.4.5 Sustainability initiatives
- 4.4.6 Digital transformation initiatives
- 4.5 Emerging/ startup competitors landscape
Chapter 5 Market Estimates and Forecast, By Product Type, 2022 - 2035 (USD Million)
- 5.1 Key trends
- 5.2 Electrical Connectors
- 5.3 Optical Connectors
- 5.4 Hybrid Connectors
Chapter 6 Market Estimates and Forecast, By Mechanical Structure, 2022 - 2035 (USD Million)
- 6.1 Key trends
- 6.2 Bulkhead Connectors (Panel-Mount)
- 6.3 Inline Connectors (Cable-to-Cable)
- 6.4 Penetrator Connectors (Pressure Hull Feedthrough)
- 6.5 Others
Chapter 7 Market Estimates and Forecast, By Mating Method, 2022 - 2035 (USD Million)
- 7.1 Key trends
- 7.2 Wet-Mate Connectors
- 7.3 Dry-Mate Connectors
Chapter 8 Market Estimates and Forecast, By Material Type, 2022 - 2035 (USD Million)
- 8.1 Key trends
- 8.2 Metals
- 8.2.1 Stainless steel
- 8.2.2 Titanium
- 8.3 Composites
- 8.4 Plastics & Polymers
- 8.5 Rubber
Chapter 9 Market Estimates and Forecast, By Connector Shape, 2022 - 2035 (USD Million)
- 9.1 Key trends
- 9.2 Circular Connectors
- 9.3 Rectangular Connectors
- 9.4 Others
- 9.4.1 Oval
- 9.4.2 D-type
- 9.4.3 Custom
Chapter 10 Market Estimates and Forecast, By Depth Rating, 2022 - 2035 (USD Million)
- 10.1 Key trends
- 10.2 Shallow Water (<200m)
- 10.3 Medium Depth (200-1,000m)
- 10.4 Deep Water (1,000-3,000m)
- 10.5 Ultra-Deep Water (>3,000m / >10,000m)
Chapter 11 Market Estimates and Forecast, By Voltage Rating, 2022 - 2035 (USD Million)
- 11.1 Key trends
- 11.2 Low Voltage (<1,000V)
- 11.3 Medium Voltage (1,000V - 10kV)
- 11.4 High Voltage (>10kV)
Chapter 12 Market Estimates and Forecast, By Application, 2022 - 2035 (USD Million)
- 12.1 Key trends
- 12.2 Offshore Oil & Gas
- 12.3 Subsea Telecommunications
- 12.4 Defense & Naval
- 12.5 Oceanographic Research
- 12.6 Renewable Energy
- 12.7 Others
- 12.7.1 Subsea Mining
- 12.7.2 Aquaculture
- 12.7.3 ROVs
Chapter 13 Market Estimates and Forecast, By Region, 2022 - 2035 (USD Million)
- 13.1 Key trends
- 13.2 North America
- 13.2.1 U.S.
- 13.2.2 Canada
- 13.3 Europe
- 13.3.1 Germany
- 13.3.2 UK
- 13.3.3 France
- 13.3.4 Spain
- 13.3.5 Italy
- 13.3.6 Netherlands
- 13.4 Asia Pacific
- 13.4.1 China
- 13.4.2 India
- 13.4.3 Japan
- 13.4.4 Australia
- 13.4.5 South Korea
- 13.5 Latin America
- 13.5.1 Brazil
- 13.5.2 Mexico
- 13.5.3 Argentina
- 13.6 Middle East and Africa
- 13.6.1 South Africa
- 13.6.2 Saudi Arabia
- 13.6.3 UAE
Chapter 14 Company Profiles
- 14.1 Amphenol Corp.
- 14.2 Baker Hughes (GE Company LLC)
- 14.3 Eaton Corporation
- 14.4 Fischer Connectors
- 14.5 Glenair Inc.
- 14.6 Hydro Group
- 14.7 MacArtney
- 14.8 Molex
- 14.9 Smiths Group Plc
- 14.10 TE Connectivity
- 14.11 Teledyne

