
PUBLISHER: Global Market Insights Inc. | PRODUCT CODE: 1959328

PUBLISHER: Global Market Insights Inc. | PRODUCT CODE: 1959328
Chiplet Interconnect Market Opportunity, Growth Drivers, Industry Trend Analysis, and Forecast 2026 - 2035
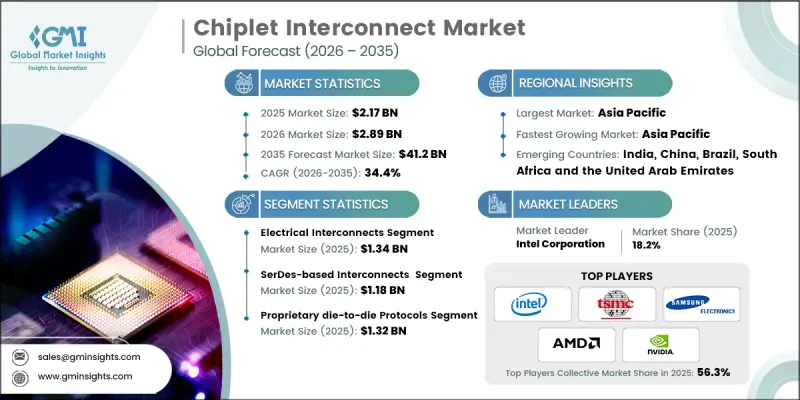
The Global Chiplet Interconnect Market was valued at USD 2.17 billion in 2025 and is estimated to grow at a CAGR of 34.4% to reach USD 41.2 billion by 2035.
The market is expanding due to the rising demand for heterogeneous integration, cost optimization at advanced process nodes, and the need to scale AI and high-performance computing (HPC) workloads. Chiplet architecture provides modular design flexibility, improved yield, and reduced reliance on monolithic chips while supporting ecosystem standardization and open interconnect protocols. Governments and industrial programs are promoting advanced packaging and modular chip strategies to accelerate innovation, increase silicon diversity, and reduce time-to-market for complex computing systems. Edge devices, data centers, and enterprise computing platforms benefit from chiplets that deliver high bandwidth, low latency, and scalable performance, addressing the limitations of standalone chips in AI, HPC, and server applications. Industry adoption is further strengthened by strategic investments in design tools, interposer technology, and substrate development.
| Market Scope | |
|---|---|
| Start Year | 2025 |
| Forecast Year | 2026-2035 |
| Start Value | $2.17 Billion |
| Forecast Value | $41.2 Billion |
| CAGR | 34.4% |
The electrical interconnects segment accounted for USD 1.34 billion in 2025. Electrical interconnects remain dominant in chiplet designs due to their reliability, ease of integration, and compatibility with existing packaging ecosystems. They are particularly suited for AI, HPC, and server processors, where mature manufacturing processes, widespread foundry support, and established design infrastructure make scaling cost-effective. Manufacturers can deploy electrical interconnects at scale in data centers, networking equipment, and enterprise computing systems, supporting high-volume adoption.
The SerDes-based interconnects segment reached USD 1.18 billion in 2025, driven by their capability to transmit high-speed data over long distances across multi-die architectures. These interconnects are ideal for advanced AI, HPC, and networking applications due to strong alignment with industry standards such as UCIe and PCIe. SerDes integration reduces design risks, accelerates adoption, and enables seamless deployment in enterprise semiconductor platforms.
North America Chiplet Interconnect Market held a 42.7% share in 2025. The region benefits from a robust semiconductor ecosystem, advanced R&D, and early access to cutting-edge packaging technologies that enable low-latency, high-bandwidth interconnects essential for AI and HPC systems. Government incentives, research partnerships, and investment in interposer and substrate technologies further strengthen North America's position in heterogeneous integration, modular chip design, and resilient semiconductor supply chains.
Leading companies in the Global Chiplet Interconnect Market include Intel Corporation, NVIDIA Corporation, Advanced Micro Devices (AMD), Taiwan Semiconductor Manufacturing Company (TSMC), Samsung Electronics, Broadcom Inc., Marvell Technology, Synopsys, Cadence Design Systems, Siemens EDA (Mentor Graphics), Alphawave Semi, Rambus Inc., Ayar Labs, ASE Technology Holding, and Amkor Technology. Key strategies adopted by companies to strengthen their position in the Global Chiplet Interconnect Market include investing heavily in R&D to develop high-bandwidth, low-latency interconnects optimized for AI, HPC, and enterprise applications. Firms are forming strategic alliances with semiconductor foundries, design tool providers, and cloud computing companies to ensure seamless ecosystem integration. Companies focus on adopting open standards such as UCIe to enhance modularity and reduce interoperability risks. They are expanding global manufacturing capabilities, including interposer and substrate production, to meet regional demand.
Table of Contents
Chapter 1 Methodology and Scope
- 1.1 Market scope and definition
- 1.2 Research design
- 1.2.1 Research approach
- 1.2.2 Data collection methods
- 1.3 Data mining sources
- 1.3.1 Global
- 1.3.2 Regional/Country
- 1.4 Base estimates and calculations
- 1.4.1 Base year calculation
- 1.4.2 Key trends for market estimation
- 1.5 Primary research and validation
- 1.5.1 Primary sources
- 1.6 Forecast model
- 1.7 Research assumptions and limitations
Chapter 2 Executive Summary
- 2.1 Industry 360° synopsis
- 2.2 Key market trends
- 2.2.1 Interconnect type trends
- 2.2.2 Signalling architecture trends
- 2.2.3 Protocol model trends
- 2.2.4 Interconnect IP layer trends
- 2.2.5 Interconnect-enabling hardware
- 2.2.6 End-use trends
- 2.2.7 Regional trends
- 2.3 TAM Analysis, 2026-2035 (USD Million)
- 2.4 CXO perspectives: Strategic imperatives
- 2.4.1 Executive decision points
- 2.4.2 Critical success factors
- 2.5 Future outlook and strategic recommendations
Chapter 3 Industry Insights
- 3.1 Industry ecosystem analysis
- 3.1.1 Supplier landscape
- 3.1.2 Profit margin
- 3.1.3 Cost structure
- 3.1.4 Value addition at each stage
- 3.1.5 Factor affecting the value chain
- 3.1.6 Disruptions
- 3.2 Industry impact forces
- 3.2.1 Growth drivers
- 3.2.1.1 Heterogeneous integration demand
- 3.2.1.2 Advanced node cost optimization
- 3.2.1.3 Ai and hpc workload scaling
- 3.2.1.4 Yield improvement and design flexibility
- 3.2.1.5 Ecosystem standardization and open interconnects
- 3.2.2 Pitfalls and challenges
- 3.2.2.1 Lack of universal interoperability
- 3.2.2.2 Thermal and power management constraints
- 3.2.1 Growth drivers
- 3.3 Growth potential analysis
- 3.4 Regulatory landscape
- 3.4.1 North America
- 3.4.2 Europe
- 3.4.3 Asia Pacific
- 3.4.4 Latin America
- 3.4.5 Middle East & Africa
- 3.5 Porter’s analysis
- 3.6 PESTEL analysis
- 3.7 Technology and Innovation landscape
- 3.7.1 Current technological trends
- 3.7.2 Emerging technologies
- 3.8 Emerging Business Models
- 3.9 Compliance Requirements
- 3.10 Supply Chain Resilience
- 3.11 Geopolitical Analysis
Chapter 4 Competitive Landscape, 2025
- 4.1 Introduction
- 4.2 Company market share analysis
- 4.2.1 By region
- 4.2.1.1 North America
- 4.2.1.2 Europe
- 4.2.1.3 Asia Pacific
- 4.2.1.4 Latin America
- 4.2.1.5 Middle East & Africa
- 4.2.2 Market concentration analysis
- 4.2.1 By region
- 4.3 Competitive benchmarking of key players
- 4.3.1 Product portfolio comparison
- 4.3.1.1 Product range breadth
- 4.3.1.2 Technology
- 4.3.1.3 Innovation
- 4.3.2 Geographic presence comparison
- 4.3.2.1 Global footprint analysis
- 4.3.2.2 Service network coverage
- 4.3.2.3 Market penetration by region
- 4.3.3 Competitive positioning matrix
- 4.3.3.1 Leaders
- 4.3.3.2 Challengers
- 4.3.3.3 Followers
- 4.3.3.4 Niche players
- 4.3.4 Strategic outlook matrix
- 4.3.1 Product portfolio comparison
- 4.4 Key developments, 2022-2025
- 4.4.1 Mergers and acquisitions
- 4.4.2 Partnerships and collaborations
- 4.4.3 Technological advancements
- 4.4.4 Expansion and investment strategies
- 4.4.5 Sustainability initiatives
- 4.4.6 Digital transformation initiatives
- 4.5 Emerging/ startup competitors landscape
Chapter 5 Market Estimates and Forecast, By Interconnect Type, 2022 - 2035 (USD Million)
- 5.1 Key trends
- 5.2 Electrical interconnects
- 5.3 Optical interconnects
Chapter 6 Market Estimates and Forecast, By Signaling Architecture, 2022 - 2035 (USD Million)
- 6.1 Key trends
- 6.2 SerDes-based interconnects
- 6.3 Parallel-based interconnects
Chapter 7 Market Estimates and Forecast, By Protocol Model, 2022 - 2035 (USD Million)
- 7.1 Key Trends
- 7.2 Open standard protocols
- 7.2.1 UCIe
- 7.2.2 BoW (Bunch of Wires)
- 7.2.3 OpenHBI
- 7.3 Proprietary die-to-die protocols
Chapter 8 Market Estimates and Forecast, By Interconnect IP Layer, 2022 - 2035 (USD Million)
- 8.1 Key Trends
- 8.2 Physical Layer (PHY) IP
- 8.2.1 SerDes PHY IP
- 8.2.2 Parallel PHY IP
- 8.2.3 Optical PHY IP
- 8.3 Controller & Protocol Layer IP
- 8.3.1 Protocol controller IP
- 8.3.2 Link & flow control IP
- 8.3.3 Coherency engine IP
- 8.3.4 Protocol adapter & bridging IP
Chapter 9 Market Estimates and Forecast, By Interconnect-Enabling Hardware, 2022 - 2035 (USD Million)
- 9.1 Key Trends
- 9.2 Silicon interposers
- 9.3 Embedded silicon bridges
- 9.4 Organic interposers & Fan-Out RDL
Chapter 10 Market Estimates and Forecast, By End-use, 2022 - 2035 (USD Million)
- 10.1 Key Trends
- 10.2 High-performance computing (HPC)
- 10.3 Artificial intelligence / machine learning accelerators
- 10.4 Data center & cloud infrastructure
- 10.5 Networking & switching ASICs
- 10.6 Automotive electronics
- 10.7 Consumer computing
- 10.8 Industrial & edge computing
- 10.9 Others
Chapter 11 Market Estimates and Forecast, By Region, 2022 - 2035 (USD Million)
- 11.1 Key trends
- 11.2 North America
- 11.2.1 U.S.
- 11.2.2 Canada
- 11.3 Europe
- 11.3.1 Germany
- 11.3.2 UK
- 11.3.3 France
- 11.3.4 Spain
- 11.3.5 Italy
- 11.3.6 Netherlands
- 11.4 Asia Pacific
- 11.4.1 China
- 11.4.2 India
- 11.4.3 Japan
- 11.4.4 Australia
- 11.4.5 South Korea
- 11.5 Latin America
- 11.5.1 Brazil
- 11.5.2 Mexico
- 11.5.3 Argentina
- 11.6 Middle East and Africa
- 11.6.1 Saudi Arabia
- 11.6.2 South Africa
- 11.6.3 UAE
Chapter 12 Company Profiles
- 12.1 Global Key Players
- 12.1.1 Advanced Micro Devices (AMD)
- 12.1.2 Intel Corporation
- 12.1.3 NVIDIA Corporation
- 12.1.4 Broadcom Inc.
- 12.1.5 Samsung Electronics
- 12.2 Regional Key Players
- 12.2.1 North America
- 12.2.1.1 Marvell Technology
- 12.2.1.2 Cadence Design Systems
- 12.2.1.3 Synopsys
- 12.2.2 Europe
- 12.2.2.1 Alphawave Semi
- 12.2.2.2 Siemens EDA (Mentor Graphics)
- 12.2.3 Asia Pacific
- 12.2.3.1 Taiwan Semiconductor Manufacturing Company (TSMC)
- 12.2.3.2 Amkor Technology
- 12.2.3.3 ASE Technology Holding
- 12.2.1 North America
- 12.3 Niche / Disruptors
- 12.3.1 Ayar Labs
- 12.3.2 Rambus Inc.

