
PUBLISHER: Global Market Insights Inc. | PRODUCT CODE: 1959334

PUBLISHER: Global Market Insights Inc. | PRODUCT CODE: 1959334
Oil and Gas OTS Market Opportunity, Growth Drivers, Industry Trend Analysis, and Forecast 2026 - 2035
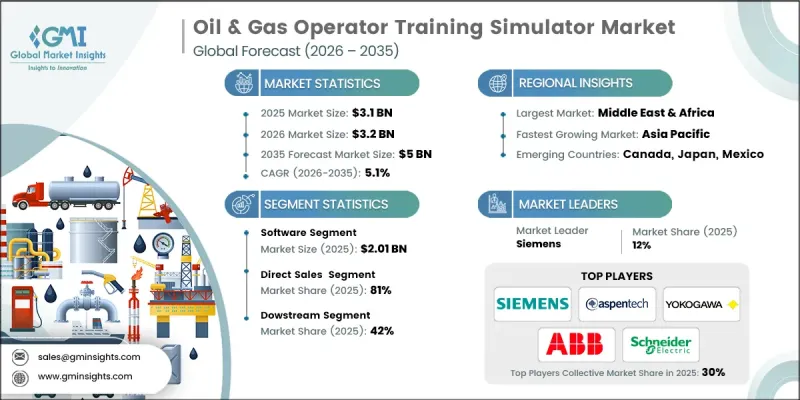
The Global Oil & Gas Operator Training Simulator Market was valued at USD 3.1 billion in 2025 and is estimated to grow at a CAGR of 5.1% to reach USD 5 billion by 2035.
The market's growth is driven by the inherently high-risk nature of oil and gas operations, where high pressure, extreme temperatures, hazardous chemicals, and complex processes can lead to catastrophic events if errors occur. Historically, major accidents in refining, offshore, and gas processing operations have emphasized the need for enhanced human performance and preventive safety measures. Operator Training Simulators (OTS) have become central to reducing operational risks by providing realistic virtual environments where operators can practice routine, abnormal, and emergency scenarios. These simulators allow operators to experience the pressures and demands of real-world operations safely. In addition to safety, the focus has shifted to proactive risk management and loss prevention. Companies are increasingly using OTS to simulate potential failures, test safety procedures, and evaluate operator responses to high-stress situations. This enables identification of gaps in training and operational procedures before actual incidents occur, improving both operational reliability and workforce competence.
| Market Scope | |
|---|---|
| Start Year | 2025 |
| Forecast Year | 2026-2035 |
| Start Value | $3.1 Billion |
| Forecast Value | $5 Billion |
| CAGR | 5.1% |
In 2025, the software segment generated USD 2.01 billion. Software forms the core of OTS systems, encompassing process simulation engines, dynamic mathematical modeling, emulated control logic, and scenario management tools. High-fidelity software relies on first-principle process models derived from actual plant performance, ensuring realistic responses to operator actions. By recreating a virtual plant environment, the software allows operators to develop skills, make informed decisions, and improve safety readiness in conditions nearly identical to real operations. This makes software indispensable for effective operator training and continuous workforce development.
The direct sales channel segment held 81% share in 2025. The high level of technical complexity, customization, and capital intensity of OTS solutions drives the preference for direct engagement with suppliers. Vendors collaborate closely with oil and gas companies to create plant-specific models, integrate with Distributed Control Systems (DCS), and ensure training scenarios reflect actual operating procedures. This approach allows operators to maintain control over system design, quality, and lifecycle support. Direct sales also foster stronger relationships between manufacturers and clients, enhancing post-installation support and long-term value.
U.S. Oil & Gas Operator Training Simulator Market captured 83% share, generating USD 0.7 billion in 2025. The U.S. market leads globally due to its extensive refining capacity, LNG export infrastructure, and advanced upstream and midstream operations. Highly automated facilities, stringent safety regulations, and environmental oversight drive demand for DCS-integrated OTS solutions with high fidelity. U.S.-based OTS suppliers and automation vendors actively promote the adoption of advanced solutions, including cloud-based simulation tools, digital twin platforms, and performance-based operator assessment systems. States with significant oil and gas activity are accelerating the deployment of these technologies, emphasizing safety, efficiency, and regulatory compliance.
Key players operating in the Global Oil & Gas Operator Training Simulator Market include ABB, Aspen Technology, ANDRITZ, AVEVA Group Limited, Designing Digitally, DNV AS, DuPont, EON Reality, ESI Group, Hyperion Group, Schneider Electric, Siemens, Tecnatom, TRAX Energy Solutions, and Yokogawa Electric. Companies in the Oil & Gas Operator Training Simulator Market are strengthening their presence by investing in high-fidelity simulation software, cloud-enabled platforms, and scenario libraries covering routine, abnormal, and emergency operations. Strategic collaborations with oil and gas operators help ensure simulators are tailored to plant-specific processes and DCS configurations. Firms are expanding service offerings, including operator performance assessments, training analytics, and remote access to simulation environments. Adoption of digital twin technology, real-time monitoring, and AI-driven evaluation tools differentiates providers and enhances value delivery.
Table of Contents
Chapter 1 Methodology and Scope
- 1.1 Market scope and definition
- 1.2 Research design
- 1.2.1 Research approach
- 1.2.2 Data collection methods
- 1.3 Data mining sources
- 1.3.1 Global
- 1.3.2 Regional/Country
- 1.4 Base estimates and calculations
- 1.4.1 Base year calculation
- 1.4.2 Key trends for market estimation
- 1.5 Primary research and validation
- 1.5.1 Primary sources
- 1.6 Forecast model
- 1.7 Research assumptions and limitations
Chapter 2 Executive Summary
- 2.1 Industry 360° synopsis
- 2.2 Key market trends
- 2.2.1 Regional
- 2.2.2 Component
- 2.2.3 Deployment model
- 2.2.4 Operations
- 2.2.5 Environmental simulation
- 2.2.6 Distribution channel
- 2.3 CXO perspectives: Strategic imperatives
- 2.3.1 Key decision points for industry executives
- 2.3.2 Critical success factors for market players
- 2.4 Future outlook and strategic recommendations
Chapter 3 Industry Insights
- 3.1 Industry ecosystem analysis
- 3.1.1 Supplier landscape
- 3.1.2 Profit margin
- 3.1.3 Value addition at each stage
- 3.1.4 Factor affecting the value chain
- 3.2 Industry impact forces
- 3.2.1 Growth drivers
- 3.2.1.1 Increasing focus on operational safety & risk reduction
- 3.2.1.2 Regulatory & compliance requirements
- 3.2.1.3 Digital transformation & industry 4.0
- 3.2.2 Industry pitfalls & challenges
- 3.2.2.1 High upfront cost
- 3.2.2.2 Technical complexity & maintenance burden
- 3.2.3 Opportunities
- 3.2.3.1 Integration with digital twins & AI
- 3.2.3.2 Modular & cloud-enabled OTS models
- 3.2.1 Growth drivers
- 3.3 Growth potential analysis
- 3.4 Future market trends
- 3.5 Technology and innovation landscape
- 3.5.1 Current technological trends
- 3.5.2 Emerging technologies
- 3.6 Price trends
- 3.6.1 By region
- 3.6.2 By component
- 3.7 Regulatory landscape
- 3.7.1 Standards and compliance requirements
- 3.7.2 Regional regulatory frameworks
- 3.7.3 Certification standards
- 3.8 Porter’s analysis
- 3.9 PESTEL analysis
Chapter 4 Competitive Landscape, 2025
- 4.1 Introduction
- 4.2 Company market share analysis
- 4.2.1 By region
- 4.2.1.1 North America
- 4.2.1.2 Europe
- 4.2.1.3 Asia Pacific
- 4.2.1.4 Latin America
- 4.2.1.5 Middle East and Africa
- 4.2.1 By region
- 4.3 Company matrix analysis
- 4.4 Competitive analysis of major market players
- 4.5 Competitive positioning matrix
- 4.6 Key developments
- 4.6.1 Mergers & acquisitions
- 4.6.2 Partnerships & collaborations
- 4.6.3 New product launches
- 4.6.4 Expansion plans
Chapter 5 Market Estimates and Forecast, By Component, 2022 - 2035 (USD Billion) (Thousand Units)
- 5.1 Key trends
- 5.2 Hardware
- 5.3 Software
- 5.3.1 Control simulation
- 5.3.2 Process simulation
- 5.3.3 Immersive simulation
- 5.4 Services
- 5.4.1 Consulting
- 5.4.2 Installation & environmental simulation
- 5.4.3 Maintenance & support
Chapter 6 Market Estimates and Forecast, By Deployment Model, 2022 - 2035 (USD Billion) (Thousand Units)
- 6.1 Key trends
- 6.2 On-Premises
- 6.3 Cloud-based
- 6.4 Hybrid
Chapter 7 Market Estimates and Forecast, By Operations, 2022 - 2035 (USD Billion) (Thousand Units)
- 7.1 Key trends
- 7.2 Upstream operations
- 7.3 Midstream operations
- 7.4 Downstream operations
Chapter 8 Market Estimates and Forecast, By Operations, 2022 - 2035 (USD Billion) (Thousand Units)
- 8.1 Key trends
- 8.2 Console operator training
- 8.3 Field operator training
Chapter 9 Market Estimates and Forecast, By Distribution Channel, 2022 - 2035 (USD Billion) (Thousand Units)
- 9.1 Key trends
- 9.2 Direct sales
- 9.3 Indirect sales
Chapter 10 Market Estimates and Forecast, By Region, 2022 - 2035 (USD Billion) (Thousand Units)
- 10.1 Key trends
- 10.2 North America
- 10.2.1 U.S.
- 10.2.2 Canada
- 10.3 Europe
- 10.3.1 Germany
- 10.3.2 UK
- 10.3.3 France
- 10.3.4 Italy
- 10.3.5 Spain
- 10.4 Asia Pacific
- 10.4.1 China
- 10.4.2 Japan
- 10.4.3 India
- 10.4.4 Australia
- 10.4.5 South Korea
- 10.5 Latin America
- 10.5.1 Brazil
- 10.5.2 Mexico
- 10.5.3 Argentina
- 10.6 Middle East and Africa
- 10.6.1 South Africa
- 10.6.2 Saudi Arabia
- 10.6.3 UAE
Chapter 11 Company Profiles
- 11.1 ABB
- 11.2 ANDRITZ
- 11.3 Aspen Technology
- 11.4 AVEVA Group Limited
- 11.5 Designing Digitally
- 11.6 DNV AS
- 11.7 DuPont
- 11.8 EON Reality
- 11.9 ESI Group
- 11.10 Hyperion Group
- 11.11 Schneider Electric
- 11.12 Siemens
- 11.13 Tecnatom
- 11.14 TRAX Energy Solutions
- 11.15 Yokogawa Electric

