
PUBLISHER: Global Market Insights Inc. | PRODUCT CODE: 1959628

PUBLISHER: Global Market Insights Inc. | PRODUCT CODE: 1959628
Offshore Wind Energy Market Opportunity, Growth Drivers, Industry Trend Analysis, and Forecast 2026 - 2035
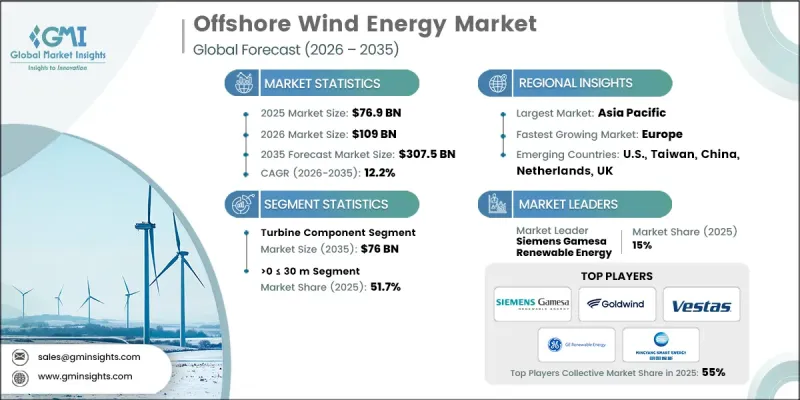
The Global Offshore Wind Energy Market was valued at USD 76.9 billion in 2025 and is estimated to grow at a CAGR of 12.2% to reach USD 307.5 billion by 2035.
Rising electricity demand, coupled with increased focus on reducing carbon emissions, has encouraged governments to implement supportive policies and regulatory frameworks, driving investments in offshore wind. The industry benefits from mechanisms such as fixed tariffs, technology-specific deployment targets, and competitive auction processes. Improvements across the supply chain, including advanced vessels, grid integration, and streamlined installation methods, are reducing project timelines and lowering costs. Innovations in foundation technologies, such as jacket and monopile structures, enable projects in deeper and more challenging marine environments. Policies like Feed-in Tariffs (FiTs) and Contracts for Difference (CfD) provide predictable revenue streams, enhancing financial security for developers. Additionally, green bonds, long-term Power Purchase Agreements (PPAs), and investment in offshore transmission infrastructure are accelerating market growth globally.
| Market Scope | |
|---|---|
| Start Year | 2025 |
| Forecast Year | 2026-2035 |
| Start Value | $76.9 Billion |
| Forecast Value | $307.5 Billion |
| CAGR | 12.2% |
The turbine segment is expected to reach USD 76 billion by 2035 as larger, more efficient turbines reduce the cost per MWh of electricity. Extended blade lengths and taller towers allow access to stronger, consistent winds, improving energy capture. Leading turbine manufacturers include Vestas, Siemens Gamesa Renewable Energy, and GE Renewable Energy, with Chinese players Goldwind and MingYang rapidly expanding their market presence.
The projects in water depths exceeding 50 meters are anticipated to grow at a CAGR of 28.5% through 2035, driven by floating turbine technologies such as spar-buoy, semi-submersible, and tension-leg platforms. Supportive policies like Japan's EEZ Bill and South Korea's OSS Bill are accelerating deepwater floating wind deployment.
U.S. Offshore Wind Energy Market was valued at USD 3.1 billion in 2025 and is forecasted to grow at a CAGR of 8.5% between 2026 and 2035. North America held a 4% market share in 2025, supported by technological advancements, favorable policies, and environmental initiatives. States including New York, New Jersey, Massachusetts, Connecticut, Rhode Island, Maryland, Virginia, and North Carolina are setting ambitious offshore wind targets. Investments in turbines, blade, tower, foundation, and cable manufacturing facilities, along with dedicated offshore wind ports on the East, Gulf, and West Coasts, are further driving market expansion.
Key players in the Global Offshore Wind Energy Market include Orsted A/S, Siemens Gamesa Renewable Energy, Vestas, GE Renewable Energy, Goldwind, China Longyuan Power Group, Enessere, Equinor ASA, Furukawa Electric, Global Energy (Group) Limited, IMPSA, LS Cable & System, Nexans, Nordex SE, Prysmian Group, RWE Renewables, Sumitomo Electric Industries, Southwire Company, Suzlon Energy Limited, and WEG. Key strategies adopted by companies in the offshore wind energy market include expanding global manufacturing and supply chain capabilities to reduce lead times, investing in R&D for larger and more efficient turbines, and deploying advanced floating foundation technologies to access deeper waters. Companies are also securing long-term Power Purchase Agreements (PPAs) to ensure steady revenue streams and participate in government-led competitive auctions to gain high-value contracts. Strategic partnerships with port operators, shipping companies, and local suppliers help optimize logistics and installation processes. Additionally, players are focusing on sustainability certifications and eco-friendly designs to strengthen brand credibility and align with regulatory requirements, enhancing their competitive positioning in the global offshore wind energy market.
Table of Contents
Chapter 1 Methodology & Scope
- 1.1 Research design
- 1.1.1 Research approach
- 1.1.2 Data collection methods
- 1.2 Base estimates and calculations
- 1.2.1 Base year calculation
- 1.2.2 Key trends for market estimates
- 1.3 Forecast model
- 1.3.1 Key trends for market estimates
- 1.3.1.1 Quantified market impact analysis
- 1.3.1.2 Mathematical impact of growth parameters on forecast
- 1.3.2 Scenario analysis framework
- 1.3.1 Key trends for market estimates
- 1.4 Primary research and validation
- 1.4.1 Some of the primary sources (but not limited to)
- 1.5 Data mining sources
- 1.5.1 Paid Sources
- 1.5.2 Sources, by region
- 1.6 Research trail & scoring components
- 1.6.1 Research trail components
- 1.6.2 Scoring components
- 1.7 Research transparency addendum
- 1.7.1 Source attribution framework
- 1.7.2 Quality assurance metrics
- 1.7.3 Our commitment to trust
- 1.8 Market definitions
Chapter 2 Executive Summary
- 2.1 Industry 360-degree synopsis, 2022 - 2035
- 2.2 Business trends
- 2.3 Component trends
- 2.4 Depth trends
- 2.5 Regional trends
Chapter 3 Industry Insights
- 3.1 Industry ecosystem
- 3.1.1 Raw material availability & sourcing analysis
- 3.1.2 Manufacturing capacity assessment
- 3.1.3 Supply chain resilience & risk factors
- 3.1.4 Distribution network analysis
- 3.2 Regulatory landscape
- 3.3 Industry impact forces
- 3.3.1 Growth drivers
- 3.3.2 Industry pitfalls & challenges
- 3.4 Growth potential analysis
- 3.5 Price trend analysis
- 3.5.1 By depth
- 3.5.2 By region
- 3.6 Cost structure analysis
- 3.7 Porter's analysis
- 3.7.1 Bargaining power of suppliers
- 3.7.2 Bargaining power of buyers
- 3.7.3 Threat of new entrants
- 3.7.4 Threat of substitutes
- 3.8 PESTEL analysis
- 3.8.1 Political factors
- 3.8.2 Economic factors
- 3.8.3 Social factors
- 3.8.4 Technological factors
- 3.8.5 Legal factors
- 3.8.6 Environmental factors
- 3.9 Emerging opportunities & trends
- 3.9.1 Digitalization & IoT integration
- 3.9.2 Emerging market penetration
- 3.10 Investment analysis and future outlook
Chapter 4 Competitive landscape, 2026
- 4.1 Introduction
- 4.2 Company market share analysis, 2025
- 4.2.1 North America
- 4.2.2 Europe
- 4.2.3 Asia Pacific
- 4.2.4 Rest of World
- 4.3 Strategic dashboard
- 4.4 Strategic initiatives
- 4.5 Innovation & technology landscape
Chapter 5 Market Size and Forecast, By Component, 2022 - 2035 (USD Billion & MW)
- 5.1 Key trends
- 5.2 Turbine
- 5.2.1 Rating
- 5.2.1.1 ≤ 2 MW
- 5.2.1.2 >2≤ 5 MW
- 5.2.1.3 >5≤ 8 MW
- 5.2.1.4 >8≤10 MW
- 5.2.1.5 >10≤ 12 MW
- 5.2.1.6 > 12 MW
- 5.2.2 Installation
- 5.2.2.1 Floating
- 5.2.2.1.1 Axis
- 5.2.2.1.1.1 Horizontal
- 5.2.2.1.1.1.1 Up wind
- 5.2.2.1.1.1.2 Down wind
- 5.2.2.1.1.2 Vertical
- 5.2.2.1.1.1 Horizontal
- 5.2.2.1.2 Component
- 5.2.2.1.2.1 Blade
- 5.2.2.1.2.2 Towers
- 5.2.2.1.2.3 Others
- 5.2.2.1.1 Axis
- 5.2.2.2 Fixed
- 5.2.2.2.1 Axis
- 5.2.2.2.1.1 Horizontal
- 5.2.2.2.1.1.1 Up wind
- 5.2.2.2.1.1.2 Down wind
- 5.2.2.2.1.2 Vertical
- 5.2.2.2.1.1 Horizontal
- 5.2.2.2.2 Component
- 5.2.2.2.2.1 Blade
- 5.2.2.2.2.2 Towers
- 5.2.2.2.2.3 Others
- 5.2.2.2.1 Axis
- 5.2.2.1 Floating
- 5.2.1 Rating
- 5.3 Support structure
- 5.3.1 Substructure (Steel)
- 5.3.2 Foundation
- 5.3.2.1 Monopile
- 5.3.2.2 Jacket
- 5.3.3 Others
- 5.4 Electrical Infrastructure
- 5.4.1 Wires & Cables
- 5.4.2 Substation
- 5.4.3 Others
- 5.5 Others
Chapter 6 Market Size and Forecast, By Depth, 2022 - 2035 (USD Billion & MW)
- 6.1 Key trends
- 6.2 > 0 to ≤ 30 m
- 6.3 > 30 to ≤ 50 m
- 6.4 > 50 m
Chapter 7 Market Size and Forecast, By Region, 2022 - 2035 (USD Billion & MW)
- 7.1 Key trends
- 7.2 North America
- 7.2.1 U.S.
- 7.2.2 Canada
- 7.3 Europe
- 7.3.1 Germany
- 7.3.2 Spain
- 7.3.3 UK
- 7.3.4 France
- 7.3.5 Italy
- 7.3.6 Sweden
- 7.3.7 Poland
- 7.3.8 Denmark
- 7.3.9 Portugal
- 7.3.10 Netherlands
- 7.3.11 Ireland
- 7.3.12 Belgium
- 7.4 Asia Pacific
- 7.4.1 China
- 7.4.2 India
- 7.4.3 Australia
- 7.4.4 Japan
- 7.4.5 South Korea
- 7.4.6 Vietnam
- 7.4.7 Philippines
- 7.4.8 Taiwan
- 7.5 Rest of World
Chapter 8 Company Profiles
- 8.1 China Longyuan Power Group
- 8.2 Enessere
- 8.3 Equinor ASA
- 8.4 Furukawa Electric
- 8.5 General Electric
- 8.6 Global Energy (Group) Limited
- 8.7 Goldwind
- 8.8 IMPSA
- 8.9 LS Cable & System
- 8.10 Nexans
- 8.11 Nordex SE
- 8.12 Ørsted A/S
- 8.13 Prysmian Group
- 8.14 RWE Renewables
- 8.15 Siemens Gamesa Renewable Energy
- 8.16 Sumitomo Electric Industries
- 8.17 Southwire Company
- 8.18 Suzlon Energy Limited
- 8.19 Vestas
- 8.20 WEG

