
PUBLISHER: Global Market Insights Inc. | PRODUCT CODE: 1959666

PUBLISHER: Global Market Insights Inc. | PRODUCT CODE: 1959666
PV Inverter Market Opportunity, Growth Drivers, Industry Trend Analysis, and Forecast 2026 - 2035
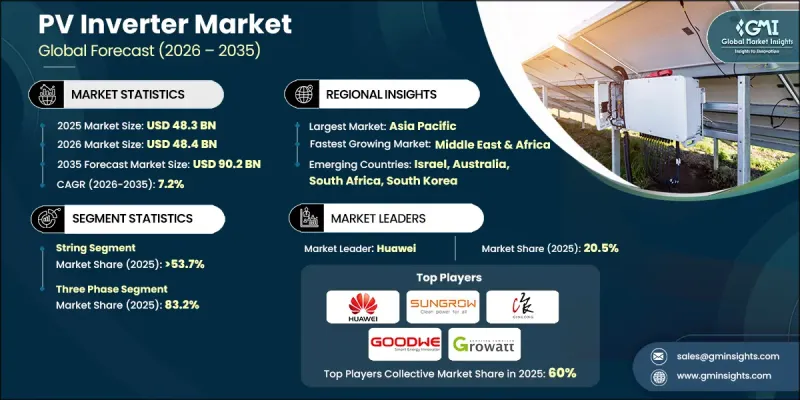
The Global PV Inverter Market was valued at USD 48.3 billion in 2025 and is estimated to grow at a 7.2% CAGR to reach USD 90.2 billion by 2035.
Market growth is supported by accelerating solar PV deployments across utility-scale parks, commercial rooftops, and residential systems that require high-efficiency conversion, tight grid synchronization, and increasingly smart grid-support functionality. As solar penetration increases, inverters are no longer viewed as simple conversion hardware; they are becoming the control layer for modern PV systems, managing voltage and frequency behavior, improving power quality, enabling remote diagnostics, and increasingly supporting hybrid configurations that combine PV with energy storage. This shift is pushing customers to prioritize long-term reliability, compliance, and lifecycle performance, not just upfront pricing, especially where grid codes and safety requirements continue to tighten.
| Market Scope | |
|---|---|
| Start Year | 2025 |
| Forecast Year | 2026-2035 |
| Start Value | $48.3 Billion |
| Forecast Value | $90.2 Billion |
| CAGR | 7.2% |
A major growth pillar is the rapid movement toward digitalization and IoT-enabled monitoring, where developers and asset owners want real-time visibility of inverter performance, predictive maintenance triggers, and faster troubleshooting to minimize downtime and maximize yields. In parallel, the market is benefiting from the rise of hybrid solar and storage systems as businesses and households seek resilience and better energy economics through backup power, peak shaving, and improved self-consumption. These trends are encouraging manufacturers to deliver inverters with stronger grid-forming / grid-support capabilities, improved communication protocols, and software-driven optimization, turning the inverter into a grid-interactive device that helps stabilize networks under high renewable penetration.
The string inverters segment held 53.7% share in 2025, as they remain the workhorse for cost-effective deployments in residential and smaller commercial installations while also scaling into larger rooftop and distributed projects with improved power ratings, multi-MPPT designs, and enhanced safety and monitoring features. String inverters continue to attract buyers looking for a strong balance of efficiency, system design flexibility, and manageable maintenance in markets where rooftops are expanding, and developers want designs that optimize BOS costs without sacrificing performance.
The three-phase segment captured 83.2% share in 2025 and is projected to grow at a CAGR of 7.5% between 2026 and 2035. The expanding deployment of commercial, industrial, and multi-unit residential solar installations is driving the adoption of three-phase PV inverters, as these systems demand balanced power distribution, higher efficiency, and stable grid performance to handle larger loads and sustained energy consumption. Additionally, stricter grid-code compliance and rising power-quality standards are boosting the demand for multi-phase inverters, which provide enhanced voltage regulation, reduced harmonic distortion, and improved frequency stability, enabling smooth integration of distributed solar generation into regional transmission and distribution networks.
U.S. PV Inverter Market held 98.8% share in 2025 and is projected to generate USD 9 billion by 2035. Rapid growth of utility-scale and distributed solar installations across the country is fueling PV inverter adoption, as federal tax credits, state-level renewable energy targets, and extensive project pipelines drive demand for efficient, grid-compliant power conversion solutions across residential, commercial, and utility solar sectors. The presence of major industry players and their continued initiatives to introduce advanced product portfolios in the region are further expected to support sustained market expansion.
Key players involved in the Global PV Inverter Market include Huawei Technologies, Sungrow Power Supply, Ginlong Solis, Growatt, Enphase Energy, SolarEdge Technologies, SMA Solar Technology, GoodWe, Delta Electronics, Siemens, Schneider Electric, TMEIC, GE Vernova, Fronius International, Canadian Solar, Altenergy Power System (APsystems), Eaton, Panasonic, SINENG, Hitachi Hi-Rel Power Electronics, DARFON, MA Solar Italy, SOFARSOLAR, TABUCHI ELECTRIC. Companies are strengthening their foothold by pushing technology differentiation, grid-support inverters with reactive power control, voltage regulation, and advanced compliance features that make approvals smoother and performance more bankable. They are investing heavily in digital platforms (cloud monitoring, remote diagnostics, predictive maintenance) to reduce downtime and create recurring revenue through subscriptions, extended warranties, and lifecycle services. Another common strategy is expanding hybrid and storage-ready inverter portfolios to capture the fast-growing solar-plus-storage demand across residential and C&I sites.
Table of Contents
Chapter 1 Methodology & Scope
- 1.1 Research design
- 1.2 Quality commitment
- 1.2.1 GMI AI policy & data integrity commitment
- 1.2.1.1 Source consistency protocol
- 1.2.1 GMI AI policy & data integrity commitment
- 1.3 Research Trail & Confidence Scoring
- 1.3.1 Research Trail Components
- 1.3.2 Scoring Components
- 1.4 Data Collection
- 1.4.1 Partial list of primary sources
- 1.5 Data mining sources
- 1.5.1 Paid sources
- 1.5.1.1 Sources, by region
- 1.5.1 Paid sources
- 1.6 Base estimates and calculations
- 1.6.1 Base year calculation for any one approach
- 1.7 Forecast model
- 1.8 Research transparency addendum
- 1.8.1 Source attribution framework
- 1.8.2 Quality assurance metrics
- 1.8.3 Our commitment to trust
- 1.9 Market definitions
Chapter 2 Executive Summary
- 2.1 Industry synopsis, 2022 - 2035
- 2.2 Business trends
- 2.3 Product trends
- 2.4 Phase trends
- 2.5 Connectivity trends
- 2.6 Nominal Output Power trends
- 2.7 Nominal Output Voltage trends
- 2.8 Application trends
- 2.9 Regional trends
Chapter 3 Industry Insights
- 3.1 Industry ecosystem
- 3.1.1 Raw material availability & sourcing analysis
- 3.1.2 Manufacturing capacity assessment
- 3.1.3 Supply chain resilience & risk factors
- 3.1.4 Distribution network analysis
- 3.2 Regulatory landscape
- 3.3 Industry impact forces
- 3.3.1 Growth drivers
- 3.3.2 Industry pitfalls & challenges
- 3.4 Growth potential analysis
- 3.5 Cost structure analysis
- 3.6 Price trend analysis (USD/MW)
- 3.6.1 By product
- 3.7 Porter's analysis
- 3.7.1 Bargaining power of suppliers
- 3.7.2 Bargaining power of buyers
- 3.7.3 Threat of new entrants
- 3.7.4 Threat of substitutes
- 3.8 PESTEL analysis
- 3.8.1 Political factors
- 3.8.2 Economic factors
- 3.8.3 Social factors
- 3.8.4 Technological factors
- 3.8.5 Legal factors
- 3.8.6 Environmental factors
- 3.9 Technology & innovation landscape
- 3.9.1 Maximum power point tracking (MPPT) advancements
- 3.9.2 AI-powered & smart inverter technologies
- 3.9.3 Hybrid inverter integration
- 3.10 Investment & funding analysis
- 3.10.1 Venture capital & private equity investments
- 3.10.2 Government incentives & subsidies impact
- 3.10.3 R&D investment trends by leading players
Chapter 4 Competitive landscape, 2026
- 4.1 Introduction
- 4.2 Company market share analysis, by region, 2025
- 4.2.1 North America
- 4.2.2 Europe
- 4.2.3 Asia Pacific
- 4.2.4 Latin America
- 4.2.5 Middle East & Africa
- 4.3 Strategic dashboard
- 4.4 Strategic initiatives
- 4.5 Company benchmarking
- 4.6 Innovation & technology landscape
Chapter 5 Market Size and Forecast, By Product, 2022 - 2035 (USD Billion & MW)
- 5.1 Key trends
- 5.2 String
- 5.3 Micro
- 5.4 Central
Chapter 6 Market Size and Forecast, By Phase, 2022 - 2035 (USD Billion & MW)
- 6.1 Key trends
- 6.2 Single phase
- 6.3 Three phase
Chapter 7 Market Size and Forecast, By Connectivity, 2022 - 2035 (USD Billion & MW)
- 7.1 Key trends
- 7.2 Standalone
- 7.3 On grid
Chapter 8 Market Size and Forecast, By Nominal Output Power, 2022 - 2035 (USD Billion & MW)
- 8.1 Key trends
- 8.2 ≤ 0.5 kW
- 8.3 0.5 - 3 kW
- 8.4 3 - 33 kW
- 8.5 33 - 110 kW
- 8.6 > 110 kW
Chapter 9 Market Size and Forecast, By Nominal Output Voltage, 2022 - 2035 (USD Billion & MW)
- 9.1 Key trends
- 9.2 ≤ 230 V
- 9.3 230 - 400 V
- 9.4 400 - 600 V
- 9.5 > 600 V
Chapter 10 Market Size and Forecast, By Application, 2022 - 2035 (USD Billion & MW)
- 10.1 Key trends
- 10.2 Residential
- 10.3 Commercial & industrial
- 10.4 Utility
Chapter 11 Market Size and Forecast, By Region, 2022 - 2035 (USD Billion & MW)
- 11.1 Key trends
- 11.2 North America
- 11.2.1 U.S.
- 11.2.2 Canada
- 11.3 Europe
- 11.3.1 Germany
- 11.3.2 Italy
- 11.3.3 Poland
- 11.3.4 Netherlands
- 11.3.5 Austria
- 11.3.6 UK
- 11.3.7 France
- 11.4 Asia Pacific
- 11.4.1 China
- 11.4.2 Australia
- 11.4.3 India
- 11.4.4 Japan
- 11.4.5 South Korea
- 11.5 Middle East & Africa
- 11.5.1 Israel
- 11.5.2 Saudi Arabia
- 11.5.3 UAE
- 11.5.4 South Africa
- 11.6 Latin America
- 11.6.1 Brazil
- 11.6.2 Mexico
- 11.6.3 Chile
Chapter 12 Company Profiles
- 12.1 Altenergy Power System
- 12.2 Canadian Solar
- 12.3 Darfon Electronics
- 12.4 Delta Electronics
- 12.5 Eaton
- 12.6 Enphase Energy
- 12.7 Fimer Group
- 12.8 Fronius International
- 12.9 General Electric
- 12.10 Ginlong Technologies
- 12.11 GoodWe
- 12.12 Growatt New Energy
- 12.13 Hitachi Hi-Rel Power Electronics
- 12.14 Huawei Technologies
- 12.15 Panasonic Corporation
- 12.16 Schneider Electric
- 12.17 SHENZHEN Sofarsolar
- 12.18 Siemens
- 12.19 SMA Solar Technology
- 12.20 Sineng Electric
- 12.21 SolarEdge Technologies
- 12.22 Sungrow
- 12.23 Tabuchi Electric
- 12.24 TMEIC

