
PUBLISHER: Global Market Insights Inc. | PRODUCT CODE: 1982347

PUBLISHER: Global Market Insights Inc. | PRODUCT CODE: 1982347
Ozone Generator Market Opportunity, Growth Drivers, Industry Trend Analysis, and Forecast 2026 - 2035
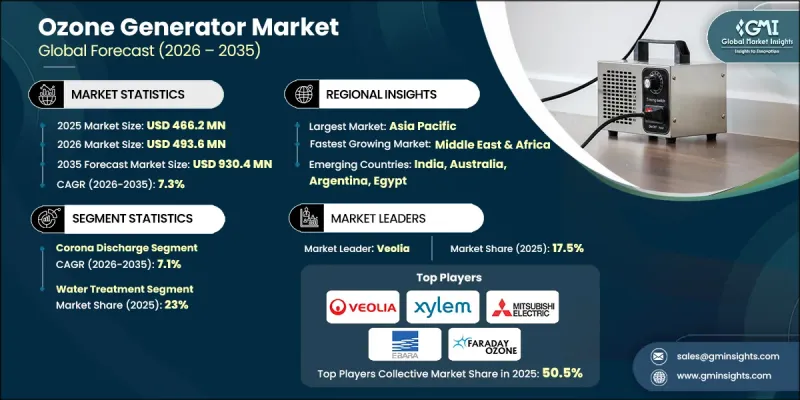
The Global Ozone Generator Market was valued at USD 466.2 million in 2025 and is estimated to grow at a CAGR of 7.3% to reach USD 930.4 million by 2035.
Rising industrial waste discharge and escalating pollution are increasingly affecting global air and water quality, driving the demand for advanced treatment technologies such as ozone generators. Ozone generators produce ozone gas by converting oxygen through methods like electrical corona discharge or ultraviolet radiation. This ozone acts as a powerful oxidant and disinfectant, widely utilized in water and wastewater treatment, air purification, odor elimination, and industrial processes. Growing urban pollution in major regions has prompted governments to implement policies aimed at improving air and water quality, boosting the market outlook. National strategies prioritizing sustainable industrial growth, coupled with regulatory support, technological advancements, and improved trade facilitation, are further enhancing the adoption of ozone-based treatment systems worldwide.
| Market Scope | |
|---|---|
| Start Year | 2025 |
| Forecast Year | 2026-2035 |
| Start Value | $466.2 Million |
| Forecast Value | $930.4 Million |
| CAGR | 7.3% |
The corona discharge technology segment held a 43.3% share in 2025 and is expected to grow at a CAGR of 7.1% through 2035. Its high output and energy-efficient design enable continuous ozone production at higher concentrations, making it ideal for large-scale water treatment plants, industrial wastewater facilities, and operations requiring reliable, scalable performance. Companies increasingly integrate this technology into their offerings, responding to customer demand and driving market growth.
The water treatment segment accounted for a 23% share in 2025 and is anticipated to grow at a CAGR of 8% from 2026 to 2035. Rising investments in drinking water purification, wastewater reuse, and water treatment infrastructure are fueling adoption. Ozone-based systems are preferred for their effective disinfection, removal of organic impurities, and ability to treat water without leaving chemical residues. Government regulations and institutional initiatives enforcing stricter water quality standards are accelerating the transition toward advanced, ozone-based water treatment solutions.
U.S. Ozone Generator Market held a 90.6% share in 2025 and is projected to generate USD 177 million by 2035. Federal and state funding for water purification, wastewater reuse, and environmental projects is supporting ozone generator adoption. Utilities increasingly rely on chemical-free disinfection technologies to comply with stricter water quality regulations and sustainability objectives. The presence of major players and strategic partnerships with emerging firms further strengthens the U.S. market position.
Key companies shaping the Global Ozone Generator Market include Aeolus Sustainable Bio Energy Pvt Ltd, Aurozone, Chemtronics, EBARA Technologies, Eltech Ozone Pvt. Ltd., Faraday Ozone, Prolux, Guangzhou Quanju Ozone Technology Co., Ltd., Minnuo Gas Equipment Co., Ltd, Mitsubishi Electric, OTSIL, Oxyzone International, OZ-AIR Malaysia, Ozonetek, Pacific Water Technology, Primozone, Salher, Veolia, Toshiba, and Xylem Water. Companies in the Global Ozone Generator Market are employing diverse strategies to expand their market presence. They are investing in research and development to enhance energy efficiency and ozone output, introducing technologically advanced solutions to meet evolving regulatory standards, and forming strategic partnerships or alliances to enter new regional markets. Many are also focusing on strengthening domestic manufacturing capabilities, expanding distribution networks, and offering tailored solutions to industries with specific water and air treatment needs. These combined efforts help firms increase market share, reinforce brand recognition, and maintain a competitive edge in the growing ozone generator market.
Table of Contents
Chapter 1 Methodology & Scope
- 1.1 Research design
- 1.2 Quality commitment
- 1.2.1 GMI AI policy & data integrity commitment
- 1.2.1.1 Source consistency protocol
- 1.2.1 GMI AI policy & data integrity commitment
- 1.3 Research Trail & Confidence Scoring
- 1.3.1 Research Trail Components
- 1.3.2 Scoring Components
- 1.4 Data Collection
- 1.4.1 Partial list of primary sources
- 1.5 Data mining sources
- 1.5.1 Paid sources
- 1.5.1.1 Sources, by region
- 1.5.1 Paid sources
- 1.6 Base estimates and calculations
- 1.6.1 Base year calculation for any one approach
- 1.7 Forecast model
- 1.8 Research transparency addendum
- 1.8.1 Source attribution framework
- 1.8.2 Quality assurance metrics
- 1.8.3 Our commitment to trust
- 1.9 Market definitions
Chapter 2 Executive Summary
- 2.1 Industry synopsis, 2022 - 2035
- 2.2 Business trends
- 2.3 Technology trends
- 2.4 Application trends
- 2.5 End use trends
- 2.6 Capacity trends
- 2.7 Regional trends
Chapter 3 Industry Insights
- 3.1 Industry ecosystem
- 3.1.1 Raw material availability & sourcing analysis
- 3.1.2 Manufacturing capacity assessment
- 3.1.3 Supply chain resilience & risk factors
- 3.1.4 Distribution network analysis
- 3.2 Regulatory landscape
- 3.3 Industry impact forces
- 3.3.1 Growth drivers
- 3.3.2 Industry pitfalls & challenges
- 3.4 Growth potential analysis
- 3.5 Porter's analysis
- 3.5.1 Bargaining power of suppliers
- 3.5.2 Bargaining power of buyers
- 3.5.3 Threat of new entrants
- 3.5.4 Threat of substitutes
- 3.6 PESTEL analysis
- 3.6.1 Political factors
- 3.6.2 Economic factors
- 3.6.3 Social factors
- 3.6.4 Technological factors
- 3.6.5 Legal factors
- 3.6.6 Environmental factors
- 3.7 Cost structure analysis
- 3.8 Price trend analysis (USD/Units)
- 3.8.1 By technology
- 3.9 Investment analysis & future outlook
- 3.9.1 Decentralization of water treatment
- 3.9.2 Digitalization and IoT integration
- 3.9.3 Energy efficiency innovations
- 3.10 Technology Innovation Landscape
- 3.10.1 Corona discharge technology advancements
- 3.10.2 Electrolytic ozone generation innovations
- 3.10.3 UV-based generation developments
- 3.10.4 Cold plasma technology evolution
Chapter 4 Competitive landscape, 2026
- 4.1 Introduction
- 4.2 Company market share analysis, by region, 2025
- 4.2.1 North America
- 4.2.2 Europe
- 4.2.3 Asia Pacific
- 4.2.4 Latin America
- 4.2.5 Middle East & Africa
- 4.3 Strategic dashboard
- 4.4 Strategic initiatives
- 4.5 Company benchmarking
- 4.6 Innovation & technology landscape
Chapter 5 Market Size and Forecast, By Technology, 2022 - 2035 (USD Million & Units)
- 5.1 Key trends
- 5.2 Ultraviolet
- 5.3 Cold plasma
- 5.4 Corona discharge
- 5.5 Electrolytic
Chapter 6 Market Size and Forecast, By Application, 2022 - 2035 (USD Million & Units)
- 6.1 Key trends
- 6.2 Water treatment
- 6.2.1 Municipal water treatment
- 6.2.2 Industrial process water treatment
- 6.2.3 Others
- 6.3 Laboratory & medical equipment
- 6.4 Air treatment
- 6.5 Others
Chapter 7 Market Size and Forecast, By End Use, 2022 - 2035 (USD Million & Units)
- 7.1 Key trends
- 7.2 Commercial
- 7.3 Municipal
- 7.4 Industrial
- 7.4.1 Automotive
- 7.4.2 Food & beverages
- 7.4.3 Textile
- 7.4.4 Pharmaceutical
- 7.4.5 Others
Chapter 8 Market Size and Forecast, By Capacity, 2022 - 2035 (USD Million & Units)
- 8.1 Key trends
- 8.2 ≥ 5 gm/hr
- 8.3 5 gm/hr - 100 gm/hr
- 8.4 100 gm/hr - 1 kg/hr
- 8.5 1 kg/hr - 5 kg/hr
- 8.6 > 5 kg/hr
Chapter 9 Market Size and Forecast, By Region, 2022 - 2035 (USD Million & Units)
- 9.1 Key trends
- 9.2 North America
- 9.2.1 U.S.
- 9.2.2 Canada
- 9.3 Europe
- 9.3.1 Germany
- 9.3.2 UK
- 9.3.3 France
- 9.3.4 Russia
- 9.3.5 Italy
- 9.3.6 Spain
- 9.4 Asia Pacific
- 9.4.1 China
- 9.4.2 Australia
- 9.4.3 India
- 9.4.4 Japan
- 9.5 Middle East & Africa
- 9.5.1 Saudi Arabia
- 9.5.2 UAE
- 9.5.3 Egypt
- 9.6 Latin America
- 9.6.1 Brazil
- 9.6.2 Argentina
Chapter 10 Company Profiles
- 10.1 Aeolus Sustainable Bio Energy Pvt Ltd
- 10.2 Aurozone
- 10.3 Chemtronics
- 10.4 EBARA Technologies
- 10.5 Eltech Ozone Pvt. Ltd.
- 10.6 Faraday Ozone
- 10.7 Prolux
- 10.8 Guangzhou Quanju Ozone Technology Co., Ltd.
- 10.9 Minnuo Gas Equipment Co., Ltd
- 10.10 Mitsubishi Electric
- 10.11 OTSIL
- 10.12 Oxyzone International
- 10.13 OZ-AIR Malaysia
- 10.14 Ozonetek
- 10.15 Pacific Water Technology
- 10.16 Primozone
- 10.17 Salher
- 10.18 Veolia
- 10.19 Toshiba
- 10.20 Xylem Water

