
PUBLISHER: Global Market Insights Inc. | PRODUCT CODE: 1998653

PUBLISHER: Global Market Insights Inc. | PRODUCT CODE: 1998653
US Bicycle Market Opportunity, Growth Drivers, Industry Trend Analysis, and Forecast 2026 - 2035
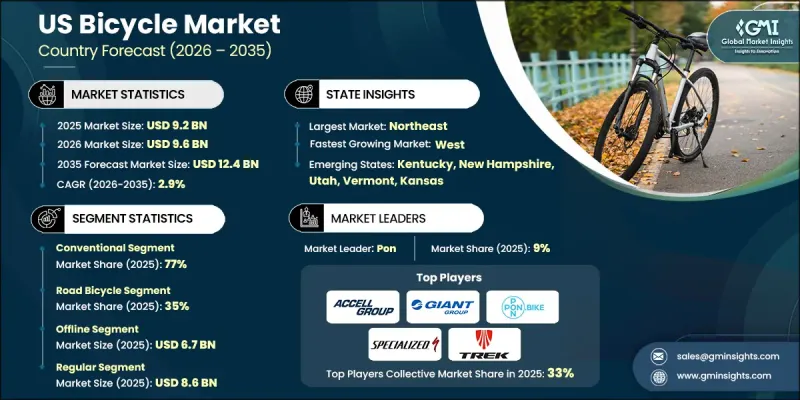
US Bicycle Market was valued at USD 9.2 billion in 2025 and is estimated to grow at a CAGR of 2.9% to reach USD 12.4 billion by 2035.
Growth in the US bicycle industry is supported by rising awareness around personal health, sustainability, and environmentally responsible transportation. Increasing urban population density is encouraging consumers to adopt bicycles as a convenient mobility option for short-distance travel and daily commuting. In addition to commuting, cycling is gaining popularity as a recreational and fitness activity across many parts of the country, which is steadily strengthening overall demand. The introduction and growing acceptance of electric bicycles has further expanded the consumer base by attracting riders seeking assisted mobility solutions. Future market expansion is expected to benefit from increasing investments in cycling infrastructure and sustainability initiatives implemented by both public institutions and private organizations. Corporate environmental, social, and governance initiatives are also supporting bicycle adoption through sustainable transportation programs. Furthermore, supply chain restructuring and localized production strategies are expected to strengthen industry stability. Despite these positive developments, pricing pressures created by elevated tariffs on imported bicycles continue to influence consumer purchasing behavior and create challenges for broader market growth across the United States bicycle market.
| Market Scope | |
|---|---|
| Start Year | 2025 |
| Forecast Year | 2026-2035 |
| Start Value | $9.2 Billion |
| Forecast Value | $12.4 Billion |
| CAGR | 2.9% |
The conventional bicycle segment held 77% share in 2025 and is forecast to grow at a CAGR of 1% between 2026 and 2035. Conventional pedal-powered bicycles continue to serve as the backbone of the United States cycling industry, maintaining widespread adoption across multiple user groups. Their affordability, mechanical simplicity, and accessibility make them a preferred option for many consumers entering the cycling market. These bicycles remain widely used by households and younger riders who view cycling as both a recreational activity and an everyday mobility option. Community-based initiatives and public bicycle sharing programs also contribute to the sustained demand for traditional bicycles across urban and suburban environments. The reliability and low maintenance requirements of conventional bicycles further strengthen their long-term appeal, ensuring that they remain a fundamental product category within the broader US bicycle industry.
The road bicycles segment held 35% share in 2025 and is anticipated to grow at a CAGR of 2.3% from 2026 to 2035. Road bicycles remain highly popular among enthusiasts who prioritize speed, endurance, and long-distance riding performance. Demand for these bicycles is supported by increasing participation in cycling-related fitness activities and competitive sports events. Lightweight frames, aerodynamic designs, and advanced gear systems make road bicycles a preferred choice for riders focused on performance and efficiency. In addition, growing consumer interest in outdoor physical activity continues to strengthen the popularity of road cycling across many regions in the United States. Manufacturers are also introducing improved materials and design innovations that enhance ride comfort and performance, which further encourages adoption among experienced riders as well as newcomers seeking high-quality cycling equipment.
Washington Bicycle Market generated USD 602 million in 2025. Washington's bicycle industry growth is supported by a strong culture of cycling and well-developed infrastructure that encourages regular bicycle usage. Continuous investments in dedicated cycling infrastructure and mobility programs are helping to promote bicycles as a practical transportation option in urban areas. Regional policies that support sustainable mobility and active transportation are further strengthening bicycle adoption among commuters and recreational riders alike. Neighboring states in the western region also demonstrate strong cycling participation rates and maintain long-standing commitments to promoting bicycle-friendly urban planning. Long-term investments in infrastructure, supportive transportation policies, and strong public interest in cycling collectively contribute to steady demand for bicycles throughout the western United States bicycle market.
Major companies operating in the US Bicycle Market include Accell, Brompton, Canyon Bicycles, Cube Bikes, Giant Manufacturing, Merida Industry, Pon, Shimano, Specialized Bicycle Components, and Trek Bicycle. Companies participating in the US Bicycle Market are implementing multiple strategies to reinforce their competitive position and expand market presence. Product innovation remains a key focus, with manufacturers investing in advanced materials, lightweight frames, and improved component technologies to enhance overall riding performance. Many companies are also expanding their electric bicycle portfolios to address the growing demand for assisted cycling solutions. Strategic partnerships with retailers and distributors are strengthening market access and improving product availability across different regions. Additionally, firms are investing in brand development and customer engagement initiatives to build long-term loyalty among cycling enthusiasts. Expansion of online sales platforms and direct-to-consumer channels is another major strategy aimed at improving purchasing convenience.
Table of Contents
Chapter 1 Methodology & Scope
- 1.1 Research approach
- 1.2 Quality Commitments
- 1.2.1 GMI AI policy & data integrity commitment
- 1.2.1.1 Source consistency protocol
- 1.2.1 GMI AI policy & data integrity commitment
- 1.3 Research Trail & Confidence Scoring
- 1.3.1 Research Trail Components
- 1.3.2 Scoring Components
- 1.4 Data Collection
- 1.4.1 Partial list of primary sources
- 1.5 Data mining sources
- 1.5.1 Paid sources
- 1.5.1.1 Sources, by region
- 1.5.1 Paid sources
- 1.6 Base estimates and calculations
- 1.6.1 Base year calculation for any one approach
- 1.7 Forecast
- 1.7.1 Quantified market impact analysis
- 1.7.1.1 Mathematical impact of growth parameters on forecast
- 1.7.1 Quantified market impact analysis
- 1.8 Research transparency addendum
- 1.8.1 Source attribution framework
- 1.8.2 Quality assurance metrics
- 1.8.3 Our commitment to trust
Chapter 2 Executive Summary
- 2.1 Industry 360° synopsis
- 2.2 Key market trends
- 2.2.1 Regional
- 2.2.2 Technology
- 2.2.3 Product
- 2.2.4 Design
- 2.2.5 Distribution Channel
- 2.2.6 End Use
- 2.3 TAM Analysis, 2026-2035
- 2.4 CXO perspectives: Strategic imperatives
Chapter 3 Industry Insights
- 3.1 Industry ecosystem analysis
- 3.1.1 Supplier landscape
- 3.1.2 Cost structure
- 3.1.3 Profit margin
- 3.1.4 Value addition at each stage
- 3.1.5 Vertical integration trends
- 3.1.6 Disruptors
- 3.2 Impact on forces
- 3.2.1 Growth drivers
- 3.2.1.1 Strong adoption from urban commuters
- 3.2.1.2 Rise demand from commuting, fitness, and leisure
- 3.2.1.3 Shifting toward direct-to-consumer (D2C)
- 3.2.1.4 Government investing in cycling infrastructure
- 3.2.2 Industry pitfalls & challenges
- 3.2.2.1 Battery and motor shortages
- 3.2.2.2 High Cost of E-bikes
- 3.2.3 Market opportunities
- 3.2.3.1 Companies are investing in domestic assembly lines
- 3.2.3.2 E-bikes with GPS, app integration, fitness tracking, and anti-theft features
- 3.2.1 Growth drivers
- 3.3 Technology trends & innovation ecosystem
- 3.3.1 Current technologies
- 3.3.2 Emerging technologies
- 3.4 Growth potential analysis
- 3.5 Regulatory landscape
- 3.5.1 Northeast
- 3.5.1.1 Complete Streets Act (New York)
- 3.5.1.2 Bicycle Helmet Law (Massachusetts)
- 3.5.2 Midwest
- 3.5.2.1 Share the Road Law (Minnesota)
- 3.5.2.2 Bicycle Safety Act (Illinois)
- 3.5.3 Southwest
- 3.5.3.1 Florida Bicycle Safety Statute
- 3.5.3.2 Virginia Traffic Safety Code - Bicycles
- 3.5.4 West
- 3.5.4.1 Oregon Bicycle Bill
- 3.5.4.2 Washington State Bicycle Safety Act
- 3.5.1 Northeast
- 3.6 Porter's analysis
- 3.7 PESTEL analysis
- 3.8 Pricing Analysis (Driven by Primary Research)
- 3.8.1 Historical Price Trend Analysis
- 3.8.2 Pricing Strategy by Player Type
- 3.9 Patent analysis (Driven by Primary Research)
- 3.10 Impact of AI & generative AI on the market
- 3.10.1 AI-driven disruption of existing business models
- 3.10.2 Predictive maintenance & bicycle management AI
- 3.10.3 Automated bicycle design optimization
- 3.10.4 Supply chain AI for demand forecasting
- 3.10.5 GenAI use cases & adoption roadmap by segment
- 3.10.5.1 Tread pattern design generation
- 3.10.5.2 Customer service chatbots & technical support
- 3.10.5.3 Marketing content creation
- 3.10.6 Risks, limitations & regulatory considerations
- 3.10.6.1 Data privacy in IoT-enabled smart bicycle
- 3.10.6.2 AI algorithm transparency requirements
- 3.10.6.3 Liability in AI-driven product failures
- 3.11 Production statistics
- 3.11.1 Production hubs
- 3.11.2 Consumption hubs
- 3.11.3 Export and import
- 3.12 Sustainability and environmental aspects
- 3.12.1 Sustainable practices
- 3.12.2 Waste reduction strategies
- 3.12.3 Energy efficiency in production
- 3.12.4 Eco-friendly initiatives
- 3.12.5 Carbon footprint considerations
- 3.13 Forecast assumptions & scenario analysis (Driven by Primary Research)
- 3.13.1 Base Case - key macro & industry variables driving CAGR
- 3.13.2 Optimistic Scenarios - Favorable Macro and Industry Tailwinds
- 3.13.3 Pessimistic Scenario - Macroeconomic slowdown or industry headwinds
Chapter 4 Competitive Landscape, 2025
- 4.1 Introduction
- 4.2 Company market share analysis
- 4.2.1 Northeast
- 4.2.2 Midwest
- 4.2.3 Southwest
- 4.2.4 West
- 4.3 Competitive analysis of major market players
- 4.4 Competitive positioning matrix
- 4.5 Key developments
- 4.5.1 Mergers & acquisitions
- 4.5.2 Partnerships & collaborations
- 4.5.3 New product launches
- 4.5.4 Expansion plans and funding
- 4.6 Company Tier Benchmarking
- 4.6.1 Tier classification criteria & qualifying thresholds
- 4.6.2 Tier positioning matrix by revenue, geography & innovation
Chapter 5 Market Estimates & Forecast, By Technology, 2022 - 2035 ($ Bn, Units)
- 5.1 Key trends
- 5.2 Electric
- 5.3 Conventional
Chapter 6 Market Estimates & Forecast, By Product, 2022 - 2035 ($ Bn, Units)
- 6.1 Key trends
- 6.2 Road bicycle
- 6.3 Cargo bicycle
- 6.4 Mountain bicycle
- 6.5 Others
Chapter 7 Market Estimates & Forecast, By Design, 2022 - 2035 ($ Bn, Units)
- 7.1 Key trends
- 7.2 Regular
- 7.3 Folding
Chapter 8 Market Estimates & Forecast, By Distribution Channel, 2022 - 2035 ($ Bn, Units)
- 8.1 Key trends
- 8.2 Offline
- 8.3 Online
Chapter 9 Market Estimates & Forecast, By End Use, 2022 - 2035 ($ Bn, Units)
- 9.1 Key trends
- 9.2 Men
- 9.3 Women
- 9.4 Kids
Chapter 10 Market Estimates & Forecast, By Region, 2022 - 2035 ($ Bn, Units)
- 10.1 Key trends
- 10.2 Northeast
- 10.2.1 Maine
- 10.2.2 New Hampshire
- 10.2.3 Vermont
- 10.2.4 Massachusetts
- 10.2.5 Rhode Island
- 10.2.6 Connecticut
- 10.2.7 New Jersey
- 10.2.8 New York
- 10.2.9 Pennsylvania
- 10.3 Midwest
- 10.3.1 Ohio
- 10.3.2 Michigan
- 10.3.3 Indiana
- 10.3.4 Illinois
- 10.3.5 Wisconsin
- 10.3.6 Minnesota
- 10.3.7 Iowa
- 10.3.8 Missouri
- 10.3.9 North Dakota
- 10.3.10 South Dakota
- 10.3.11 Nebraska
- 10.3.12 Kansas
- 10.4 South
- 10.4.1 Delaware
- 10.4.2 Maryland
- 10.4.3 Virginia
- 10.4.4 West Virginia
- 10.4.5 North Carolina
- 10.4.6 South Carolina
- 10.4.7 Georgia
- 10.4.8 Florida
- 10.4.9 Alabama
- 10.4.10 Kentucky
- 10.4.11 Mississippi
- 10.4.12 Tennessee
- 10.4.13 Arkansas
- 10.4.14 Louisiana
- 10.4.15 Oklahoma
- 10.4.16 Texas
- 10.5 West
- 10.5.1 Montana
- 10.5.2 Idaho
- 10.5.3 Wyoming
- 10.5.4 Colorado
- 10.5.5 New Mexico
- 10.5.6 Arizona
- 10.5.7 Utah
- 10.5.8 Nevada
- 10.5.9 Washington
- 10.5.10 Oregon
- 10.5.11 California
- 10.5.12 Alaska
- 10.5.13 Hawaii
Chapter 11 Company Profiles
- 11.1 Global players
- 11.1.1 Accell
- 11.1.2 Brompton
- 11.1.3 Cannondale Bicycle
- 11.1.4 Canyon Bicycles
- 11.1.5 Cube Bikes
- 11.1.6 Giant Manufacturing
- 11.1.7 Merida Industry
- 11.1.8 Pon
- 11.1.9 Shimano
- 11.1.10 Specialized Bicycle Components
- 11.1.11 Trek Bicycle
- 11.2 Regional players
- 11.2.1 Electra Bicycle Company
- 11.2.2 Felt Bicycles
- 11.2.3 Jamis Bicycles
- 11.2.4 Priority Bicycles
- 11.2.5 Salsa Cycles
- 11.2.6 Santa Cruz Bicycles
- 11.3 Emerging players
- 11.3.1 Dorel Industries
- 11.3.2 Hero Cycles
- 11.3.3 Surly Bikes

