
PUBLISHER: Global Market Insights Inc. | PRODUCT CODE: 1998745

PUBLISHER: Global Market Insights Inc. | PRODUCT CODE: 1998745
Optical Transceiver Market Opportunity, Growth Drivers, Industry Trend Analysis, and Forecast 2026 - 2035
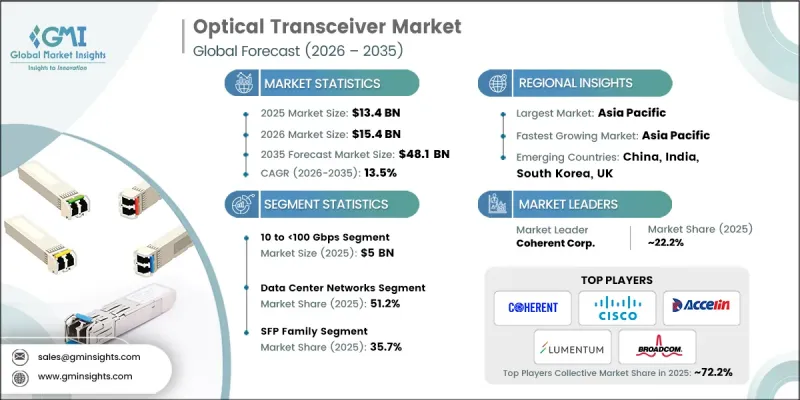
The Global Optical Transceiver Market was valued at USD 13.4 billion in 2025 and is estimated to grow at a CAGR of 13.5% to reach USD 48.1 billion by 2035.
The market growth is driven by the ongoing shift toward high-bandwidth digital infrastructure across enterprises, cloud, and telecom networks. Demand is fueled by the widespread deployment of coherent pluggables in telecom transport, the expansion of distributed edge computing facilities, and the rising need for high-speed interconnects to support cloud-native applications and content delivery platforms. Increasing investments in hyperscale data centers to implement 800G and 1.6T connectivity, combined with submarine cable capacity expansions, are enhancing global data transmission capabilities. Continued upgrades of metro networks, improved DSP efficiency, higher port-density switches, and adoption of standard-based coherent optics accelerate deployment. The trend toward disaggregated coherent optics, first catalyzed by 400ZR pluggable standardization around 2020, is expected to continue through 2030, promoting vendor diversification and flexible network architectures.
| Market Scope | |
|---|---|
| Start Year | 2025 |
| Forecast Year | 2026-2035 |
| Start Value | $13.4 Billion |
| Forecast Value | $48.1 Billion |
| CAGR | 13.5% |
The 10 to <100 Gbps segment reached USD 5 billion in 2025, due to its widespread presence across enterprise, telecom aggregation, and mobile access networks. Links in the 10G, 25G, and 50G range remain extensively deployed worldwide, resulting in consistent replacement and upgrade demand. These solutions are cost-effective and maintain high compatibility with existing switching infrastructure, sustaining shipment volumes in enterprise and telecom environments.
The SFP family segment held a 35.7% share in 2025, encompassing SFP+, SFP28, and SFP56 modules. Their backward compatibility, affordability, and suitability for 1G to 25G applications make them widely adopted across enterprise networks, metro access, and legacy data centers. Continued deployment in broadband aggregation and enterprise switching ensures steady demand across both mature and emerging markets.
North America Optical Transceiver Market accounted for 28.3% share in 2025. The region's growth is supported by large-scale hyperscale data center expansions, rapid AI infrastructure adoption, and upgrades to 400G and 800G interconnects. North America hosts a significant concentration of cloud service providers, driving sustained capital expenditure on coherent transport networks and broadband backbone enhancements. Government and operator initiatives to strengthen subsea and metro infrastructure further reinforce the region's technology leadership, expected to continue through 2035.
Prominent players in the Global Optical Transceiver Market include Accelink Technologies Co., Ltd., Eoptolink Technology Inc., Cisco Systems, Inc., Applied Optoelectronics, Inc., Coherent Corp. (formerly II-VI Incorporated), Fujitsu Optical Components Limited, Lumentum Holdings Inc., Molex, LLC, Sumitomo Electric Industries, Ltd., ATOP Corporation, ColorChip Ltd., Linktel Technologies Co., Ltd., Smiths Interconnect, Broadcom Inc., Hisense Broadband, and Source Photonics, Inc. Companies in the Optical Transceiver Market are strengthening their position by investing heavily in research and development to launch high-speed, energy-efficient, and scalable transceivers. Strategic partnerships with telecom operators, hyperscale cloud providers, and data center integrators enable faster adoption and market penetration. Firms are diversifying their portfolios to include coherent pluggables, high-bandwidth SFP modules, and disaggregated solutions to meet evolving network needs. Expansion of global manufacturing and logistics capabilities ensures timely delivery and scalability. Additionally, companies are focusing on standard compliance, interoperability testing, and collaborative ecosystem development to maintain credibility and expand their share in both mature and emerging markets.
Table of Contents
Chapter 1 Methodology and Scope
- 1.1 Market scope and definition
- 1.2 Research design
- 1.2.1 Research approach
- 1.2.2 Data collection methods
- 1.3 Data mining sources
- 1.3.1 Global
- 1.3.2 Regional/Country
- 1.4 Base estimates and calculations
- 1.4.1 Base year calculation
- 1.4.2 Key trends for market estimation
- 1.5 Primary research and validation
- 1.5.1 Primary sources
- 1.6 Forecast model
- 1.7 Research assumptions and limitations
Chapter 2 Executive Summary
- 2.1 Industry 360° synopsis, 2022 - 2035
- 2.2 Key market trends
- 2.2.1 Form factor trends
- 2.2.2 Data rate trends
- 2.2.3 Protocol trends
- 2.2.4 Deployment environment trends
- 2.2.5 Procurement channel trends
- 2.2.6 Connector type trends
- 2.2.7 Regional trends
- 2.3 TAM Analysis, 2026-2035
- 2.4 CXO perspectives: Strategic imperatives
- 2.4.1 Executive decision points
- 2.4.2 critical success factors
- 2.5 Future outlook and strategic recommendations
Chapter 3 Industry Insights
- 3.1 Industry ecosystem analysis
- 3.1.1 Supplier Landscape
- 3.1.2 Profit Margin
- 3.1.3 Cost structure
- 3.1.4 Value addition at each stage
- 3.1.5 Factor affecting the value chain
- 3.1.6 Disruptions
- 3.2 Industry impact forces
- 3.2.1 Growth drivers
- 3.2.1.1 800G and 1.6T hyperscale data center deployments
- 3.2.1.2 AI/ML cluster interconnect bandwidth expansion
- 3.2.1.3 Submarine cable capacity expansion projects
- 3.2.1.4 5G fronthaul and midhaul fiber densification
- 3.2.1.5 Co-packaged optics development initiatives
- 3.2.2 Industry pitfalls and challenges
- 3.2.2.1 Thermal management complexity in dense racks
- 3.2.2.2 High 800G module power consumption
- 3.2.3 Market opportunities
- 3.2.3.1 Silicon photonics integration commercialization
- 3.2.3.2 Edge data center optical upgrade cycles
- 3.2.1 Growth drivers
- 3.3 Growth potential analysis
- 3.4 Regulatory landscape
- 3.4.1 North America
- 3.4.2 Europe
- 3.4.3 Asia Pacific
- 3.4.4 Latin America
- 3.4.5 Middle East & Africa
- 3.5 Porter's analysis
- 3.6 PESTEL analysis
- 3.7 Technology and Innovation landscape
- 3.7.1 Current technological trends
- 3.7.2 Emerging technologies
- 3.8 Price trends
- 3.8.1 By region
- 3.8.2 By product
- 3.9 Pricing Strategies
- 3.10 Emerging Business Models
- 3.11 Compliance Requirements
- 3.12 Patent and IP analysis
- 3.13 Geopolitical and trade dynamics
Chapter 4 Competitive Landscape, 2025
- 4.1 Introduction
- 4.2 Company market share analysis
- 4.2.1 By region
- 4.2.1.1 North America
- 4.2.1.2 Europe
- 4.2.1.3 Asia Pacific
- 4.2.1.4 Latin America
- 4.2.1.5 Middle East & Africa
- 4.2.2 Market concentration analysis
- 4.2.1 By region
- 4.3 Competitive benchmarking of key players
- 4.3.1 Financial performance comparison
- 4.3.1.1 Revenue
- 4.3.1.2 Profit margin
- 4.3.1.3 R&D
- 4.3.2 Product portfolio comparison
- 4.3.2.1 Product range breadth
- 4.3.2.2 Technology
- 4.3.2.3 Innovation
- 4.3.3 Geographic presence comparison
- 4.3.3.1 Global footprint analysis
- 4.3.3.2 Service network coverage
- 4.3.3.3 Market penetration by region
- 4.3.4 Competitive positioning matrix
- 4.3.4.1 Leaders
- 4.3.4.2 Challengers
- 4.3.4.3 Followers
- 4.3.4.4 Niche players
- 4.3.5 Strategic outlook matrix
- 4.3.1 Financial performance comparison
- 4.4 Key developments
- 4.4.1 Mergers and acquisitions
- 4.4.2 Partnerships and collaborations
- 4.4.3 Technological advancements
- 4.4.4 Expansion and investment strategies
- 4.4.5 Digital transformation initiatives
- 4.5 Emerging/ startup competitors landscape
Chapter 5 Market Estimates and Forecast, By Form Factor, 2022 - 2035 (USD Million)
- 5.1 Key trends
- 5.2 SFP family (SFP, SFP+, SFP28, SFP56, SFP112, SFP-DD)
- 5.3 QSFP family (QSFP, QSFP+, QSFP28, QSFP56, QSFP-DD)
- 5.4 OSFP
- 5.5 CFP family (CFP, CFP2, CFP4)
- 5.6 XFP
- 5.7 CXP
Chapter 6 Market Estimates and Forecast, By Data Rate, 2022 - 2035 (USD Million)
- 6.1 Key trends
- 6.2 Less than 10 Gbps
- 6.3 10 to <100 Gbps
- 6.4 100 to <400 Gbps
- 6.5 400 to <800 Gbps
- 6.6 800 Gbps and above
Chapter 7 Market Estimates and Forecast, By Protocol, 2022 - 2035 (USD Million)
- 7.1 Key trends
- 7.2 Ethernet
- 7.3 Fibre channel
- 7.4 InfiniBand
- 7.5 OTN (optical transport network)
- 7.6 SONET/SDH
- 7.7 PON (passive optical network)
- 7.8 CPRI/eCPRI (common public radio interface)
- 7.9 PCIe over optical
Chapter 8 Market Estimates and Forecast, By Procurement Channel, 2022 - 2035 (USD Million)
- 8.1 Key trends
- 8.2 OEM-bundled procurement
- 8.3 Direct manufacturer procurement
- 8.4 Third-party compatible/aftermarket procurement
- 8.5 Distribution channel procurement
- 8.6 System integrator/turnkey solution procurement
Chapter 9 Market Estimates and Forecast, By Deployment Environment, 2022 - 2035 (USD Million)
- 9.1 Key trends
- 9.2 Data center networks
- 9.3 Telecom/carrier networks
- 9.4 Enterprise campus/LAN networks
- 9.5 Industrial/OT networks
- 9.6 Defense & military networks
Chapter 10 Market Estimates and Forecast, By Connector Type, 2022 - 2035 (USD Million)
- 10.1 Key trends
- 10.2 LC (lucent connector)
- 10.3 SC (subscriber connector)
- 10.4 MPO/MTP (multi-fiber push-on/pull)
- 10.5 FC (ferrule connector)
- 10.6 ST (straight tip)
- 10.7 RJ45 (copper interface)
Chapter 11 Market Estimates and Forecast, By Region, 2022 - 2035 (USD Million)
- 11.1 Key trends
- 11.2 North America
- 11.2.1 U.S.
- 11.2.2 Canada
- 11.3 Europe
- 11.3.1 Germany
- 11.3.2 UK
- 11.3.3 France
- 11.3.4 Spain
- 11.3.5 Italy
- 11.3.6 Russia
- 11.4 Asia Pacific
- 11.4.1 China
- 11.4.2 India
- 11.4.3 Japan
- 11.4.4 Australia
- 11.4.5 South Korea
- 11.5 Latin America
- 11.5.1 Brazil
- 11.5.2 Mexico
- 11.5.3 Argentina
- 11.6 Middle East and Africa
- 11.6.1 South Africa
- 11.6.2 Saudi Arabia
- 11.6.3 UAE
Chapter 12 Company Profiles
- 12.1 Global Key Players
- 12.1.1 Cisco Systems, Inc.
- 12.1.2 Broadcom Inc.
- 12.1.3 Coherent Corp.
- 12.1.4 Lumentum Holdings Inc.
- 12.1.5 Sumitomo Electric Industries, Ltd.
- 12.2 Regional key players
- 12.2.1 North America
- 12.2.1.1 Applied Optoelectronics, Inc.
- 12.2.1.2 Molex, LLC
- 12.2.2 Asia Pacific
- 12.2.2.1 Accelink Technologies Co., Ltd.
- 12.2.2.2 Eoptolink Technology Inc., Ltd.
- 12.2.2.3 Fujitsu Optical Components Limited
- 12.2.2.4 Hisense Broadband
- 12.2.2.5 Linktel Technologies Co., Ltd.
- 12.2.2.6 Source Photonics, Inc.
- 12.2.3 Europe
- 12.2.3.1 Smiths Interconnect
- 12.2.1 North America
- 12.3 Niche Players/Disruptors
- 12.3.1 ATOP Corporation
- 12.3.2 ColorChip Ltd.

