
PUBLISHER: Global Market Insights Inc. | PRODUCT CODE: 2019018

PUBLISHER: Global Market Insights Inc. | PRODUCT CODE: 2019018
GaN Power Transistors Market Opportunity, Growth Drivers, Industry Trend Analysis, and Forecast 2026 - 2035
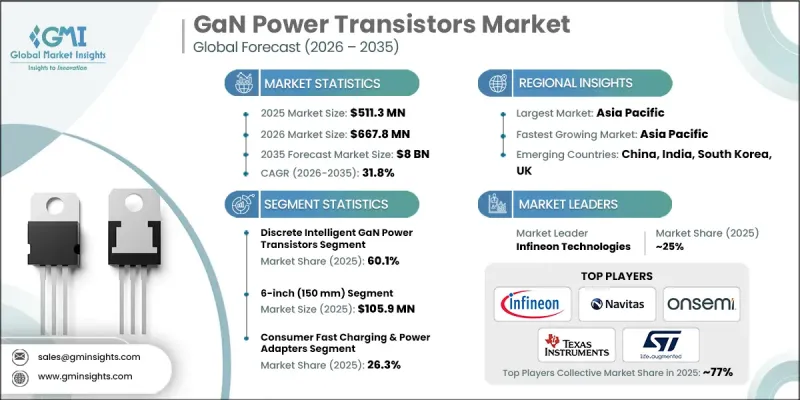
The Global GaN Power Transistors Market was valued at USD 511.3 million in 2025 and is estimated to grow at a CAGR of 31.8% to reach USD 8 billion by 2035.
Market growth is fueled by the expanding application of GaN technologies across next-generation electric mobility platforms and supportive government initiatives promoting the development of wide-bandgap semiconductor manufacturing. These factors are accelerating commercialization, boosting production capabilities, and encouraging broader integration of GaN devices across multiple end-use sectors. In addition, increasing focus on energy efficiency and performance optimization is strengthening demand for GaN-based architectures. The market is also benefiting from technological advancements that enhance reliability and scalability, enabling wider acceptance in critical applications. As manufacturing ecosystems mature and regulatory frameworks continue to evolve, GaN power transistors are becoming a key component in modern power electronics, positioning the market for sustained long-term expansion across global industries.
| Market Scope | |
|---|---|
| Start Year | 2025 |
| Forecast Year | 2026-2035 |
| Start Value | $511.3 Million |
| Forecast Value | $8 Billion |
| CAGR | 31.8% |
The GaN power transistors market continues to expand as electrification trends and energy efficiency targets reshape power system designs. Adoption is increasing as power conversion technologies transition toward higher efficiency architectures supported by favorable policy frameworks. At the same time, growing emphasis on optimizing power infrastructure is accelerating the integration of GaN devices into advanced systems. The market is also witnessing increased deployment in demanding operating conditions where performance limitations of traditional materials have driven the need for alternatives.
The discrete intelligent GaN power transistors segment held a 60.1% share in 2025, supported by strong demand across high-volume applications. These components provide greater design adaptability, cost efficiency, and simplified integration into existing system architectures. Their ability to support performance optimization at the system level has made them a preferred solution for manufacturers seeking flexibility while maintaining cost control.
The 6-inch (150 mm) wafer segment generated USD 105.9 million in 2025, reflecting its position as the most established production platform for GaN-on-silicon technology. Mature fabrication techniques, consistent yields, and optimized cost structures have enabled scalable manufacturing. This wafer size continues to deliver a balanced combination of efficiency, performance, and economic viability, supporting widespread adoption across multiple industries.
North America GaN Power Transistors Market accounted for 28.6% share in 2025, driven by strong investments in advanced semiconductor technologies and infrastructure development. The region is experiencing increased adoption as organizations prioritize system efficiency and compact design improvements. Public and private sector initiatives focused on innovation and clean energy are further reinforcing growth, alongside continued investment in research and development activities related to wide-bandgap materials.
Key participants in the Global GaN Power Transistors Market include Efficient Power Conversion (EPC), Infineon Technologies, Innoscience Technology, Mitsubishi Electric, Navitas Semiconductor, Nexperia, Onsemi, Panasonic, Power Integrations, Inc., Renesas Electronics (Transphorm), STMicroelectronics, Texas Instruments, Toshiba, VisIC Technologies, and Wolfspeed. Companies operating in the Global GaN Power Transistors Market are focusing on a combination of innovation, capacity expansion, and strategic collaborations to strengthen their competitive position. Leading players are investing heavily in research and development to enhance device performance, efficiency, and reliability while reducing production costs. Partnerships with technology providers and system manufacturers are helping accelerate product integration and market penetration. Firms are also expanding manufacturing capabilities to meet rising demand and improve supply chain resilience. In addition, many companies are pursuing vertical integration strategies to gain better control over production processes and materials.
Table of Contents
Chapter 1 Methodology and Scope
- 1.1 Market scope and definition
- 1.2 Research design
- 1.2.1 Research approach
- 1.2.2 Data collection methods
- 1.3 Data mining sources
- 1.3.1 Global
- 1.3.2 Regional/Country
- 1.4 Base estimates and calculations
- 1.4.1 Base year calculation
- 1.4.2 Key trends for market estimation
- 1.5 Primary research and validation
- 1.5.1 Primary sources
- 1.6 Forecast model
- 1.7 Research assumptions and limitations
Chapter 2 Executive Summary
- 2.1 Industry 360° synopsis, 2022 - 2035
- 2.2 Key market trends
- 2.2.1 Product form trends
- 2.2.2 Wafer size trends
- 2.2.3 Voltage rating trends
- 2.2.4 Functional integration level trends
- 2.2.5 Application trends
- 2.2.6 Regional trends
- 2.3 TAM Analysis, 2026-2035
- 2.4 CXO perspectives: Strategic imperatives
- 2.4.1 Executive decision points
- 2.4.2 critical success factors
- 2.5 Future outlook and strategic recommendations
Chapter 3 Industry Insights
- 3.1 Industry ecosystem analysis
- 3.1.1 Supplier Landscape
- 3.1.2 Profit Margin
- 3.1.3 Cost structure
- 3.1.4 Value addition at each stage
- 3.1.5 Factor affecting the value chain
- 3.1.6 Disruptions
- 3.2 Industry impact forces
- 3.2.1 Growth drivers
- 3.2.1.1 EV onboard chargers shifting to high-efficiency GaN architectures
- 3.2.1.2 Data center power supplies targeting 80 Plus Titanium
- 3.2.1.3 Consumer electronics OEMs adopting USB-C PD GaN adapters
- 3.2.1.4 Automotive OEMs qualifying GaN for 800V platforms
- 3.2.1.5 Wide-bandgap policies supporting domestic semiconductor manufacturing investments
- 3.2.2 Industry pitfalls and challenges
- 3.2.2.1 Thermal management complexity in high-power GaN designs
- 3.2.2.2 Limited long-term reliability data for automotive-grade GaN
- 3.2.3 Market opportunities
- 3.2.3.1 Solid-state transformers using high-voltage GaN devices
- 3.2.3.2 Aerospace power systems demanding lightweight, high-efficiency converters
- 3.2.1 Growth drivers
- 3.3 Growth potential analysis
- 3.4 Regulatory landscape
- 3.4.1 North America
- 3.4.2 Europe
- 3.4.3 Asia Pacific
- 3.4.4 Latin America
- 3.4.5 Middle East & Africa
- 3.5 Porter's analysis
- 3.6 PESTEL analysis
- 3.7 Technology and Innovation landscape
- 3.7.1 Current technological trends
- 3.7.2 Emerging technologies
- 3.8 Price trends
- 3.8.1 By region
- 3.8.2 By product
- 3.9 Pricing Strategies
- 3.10 Emerging Business Models
- 3.11 Compliance Requirements
- 3.12 Patent and IP analysis
- 3.13 Geopolitical and trade dynamics
Chapter 4 Competitive Landscape, 2025
- 4.1 Introduction
- 4.2 Company market share analysis
- 4.2.1 By region
- 4.2.1.1 North America
- 4.2.1.2 Europe
- 4.2.1.3 Asia Pacific
- 4.2.1.4 Latin America
- 4.2.1.5 Middle East & Africa
- 4.2.2 Market concentration analysis
- 4.2.1 By region
- 4.3 Competitive benchmarking of key players
- 4.3.1 Financial performance comparison
- 4.3.1.1 Revenue
- 4.3.1.2 Profit margin
- 4.3.1.3 R&D
- 4.3.2 Product portfolio comparison
- 4.3.2.1 Product range breadth
- 4.3.2.2 Technology
- 4.3.2.3 Innovation
- 4.3.3 Geographic presence comparison
- 4.3.3.1 Global footprint analysis
- 4.3.3.2 Service network coverage
- 4.3.3.3 Market penetration by region
- 4.3.4 Competitive positioning matrix
- 4.3.4.1 Leaders
- 4.3.4.2 Challengers
- 4.3.4.3 Followers
- 4.3.4.4 Niche players
- 4.3.5 Strategic outlook matrix
- 4.3.1 Financial performance comparison
- 4.4 Key developments
- 4.4.1 Mergers and acquisitions
- 4.4.2 Partnerships and collaborations
- 4.4.3 Technological advancements
- 4.4.4 Expansion and investment strategies
- 4.4.5 Digital transformation initiatives
- 4.5 Emerging/ startup competitors landscape
Chapter 5 Market Estimates and Forecast, By Product Form, 2022 - 2035 (USD Million)
- 5.1 Key trends
- 5.2 Discrete intelligent GaN power transistors
- 5.3 Intelligent GaN power modules
Chapter 6 Market Estimates and Forecast, By Wafer Size, 2022 - 2035 (USD Million)
- 6.1 Key trends
- 6.2 4-inch (100 mm)
- 6.3 6-inch (150 mm)
- 6.4 8-inch (200 mm)
- 6.5 12-inch (300 mm)
Chapter 7 Market Estimates and Forecast, By Voltage Rating, 2022 - 2035 (USD Million)
- 7.1 Key trends
- 7.2 ≤ 200 V
- 7.3 201-650 V
- 7.4 651-1200 V
- 7.5 > 1200 V
Chapter 8 Market Estimates and Forecast, By Functional Integration Level, 2022 - 2035 (USD Million)
- 8.1 Key trends
- 8.2 Gate driver-integrated GaN transistors
- 8.3 Protection & sensing-integrated GaN transistors
- 8.4 Fully intelligent GaN Devices
Chapter 9 Market Estimates and Forecast, By Application, 2022 - 2035 (USD Million)
- 9.1 Key trends
- 9.2 Consumer fast charging & power adapters
- 9.3 Automotive power electronics
- 9.4 Industrial power conversion
- 9.5 Data center & server power
- 9.6 Telecom infrastructure power
- 9.7 Renewable energy & energy storage
- 9.8 Others
Chapter 10 Market Estimates and Forecast, By Region, 2022 - 2035 (USD Million)
- 10.1 Key trends
- 10.2 North America
- 10.2.1 U.S.
- 10.2.2 Canada
- 10.3 Europe
- 10.3.1 Germany
- 10.3.2 UK
- 10.3.3 France
- 10.3.4 Spain
- 10.3.5 Italy
- 10.4 Asia Pacific
- 10.4.1 China
- 10.4.2 India
- 10.4.3 Japan
- 10.4.4 Australia
- 10.4.5 South Korea
- 10.5 Latin America
- 10.5.1 Brazil
- 10.5.2 Mexico
- 10.5.3 Argentina
- 10.6 Middle East and Africa
- 10.6.1 South Africa
- 10.6.2 Saudi Arabia
- 10.6.3 UAE
Chapter 11 Company Profiles
- 11.1 Global Key Players
- 11.1.1 Infineon Technologies
- 11.1.2 Texas Instruments
- 11.1.3 STMicroelectronics
- 11.1.4 Onsemi
- 11.1.5 Renesas Electronics (Transphorm)
- 11.1.6 Toshiba
- 11.1.7 Panasonic
- 11.1.8 Power Integrations, Inc
- 11.2 Regional key players
- 11.2.1 North America
- 11.2.1.1 Navitas Semiconductor
- 11.2.1.2 Wolfspeed
- 11.2.1.3 Efficient Power Conversion (EPC)
- 11.2.2 Asia Pacific
- 11.2.2.1 Mitsubishi Electric
- 11.2.2.2 Innoscience Technology
- 11.2.3 Europe
- 11.2.3.1 Nexperia
- 11.2.1 North America
- 11.3 Niche Players/Disruptors
- 11.3.1 VisIC Technologies

